Creating a Google Maps Object
This topic describes how to add a new Google Maps Object to a Screen or a Container and its specific properties.
Due to a Google Maps security content update, the Google Maps Objects will only work with versions 12.6 or newer. If you have any concerns regarding the Google Maps Object, please reach out to your Customer Success Manager.
To create a new map, you need to access a Screen in Design mode.
Once you're in the Screen editing page, locate the Google Maps Object from the Screen Objects list in the left panel, then drag and drop it onto your Screen or Container.
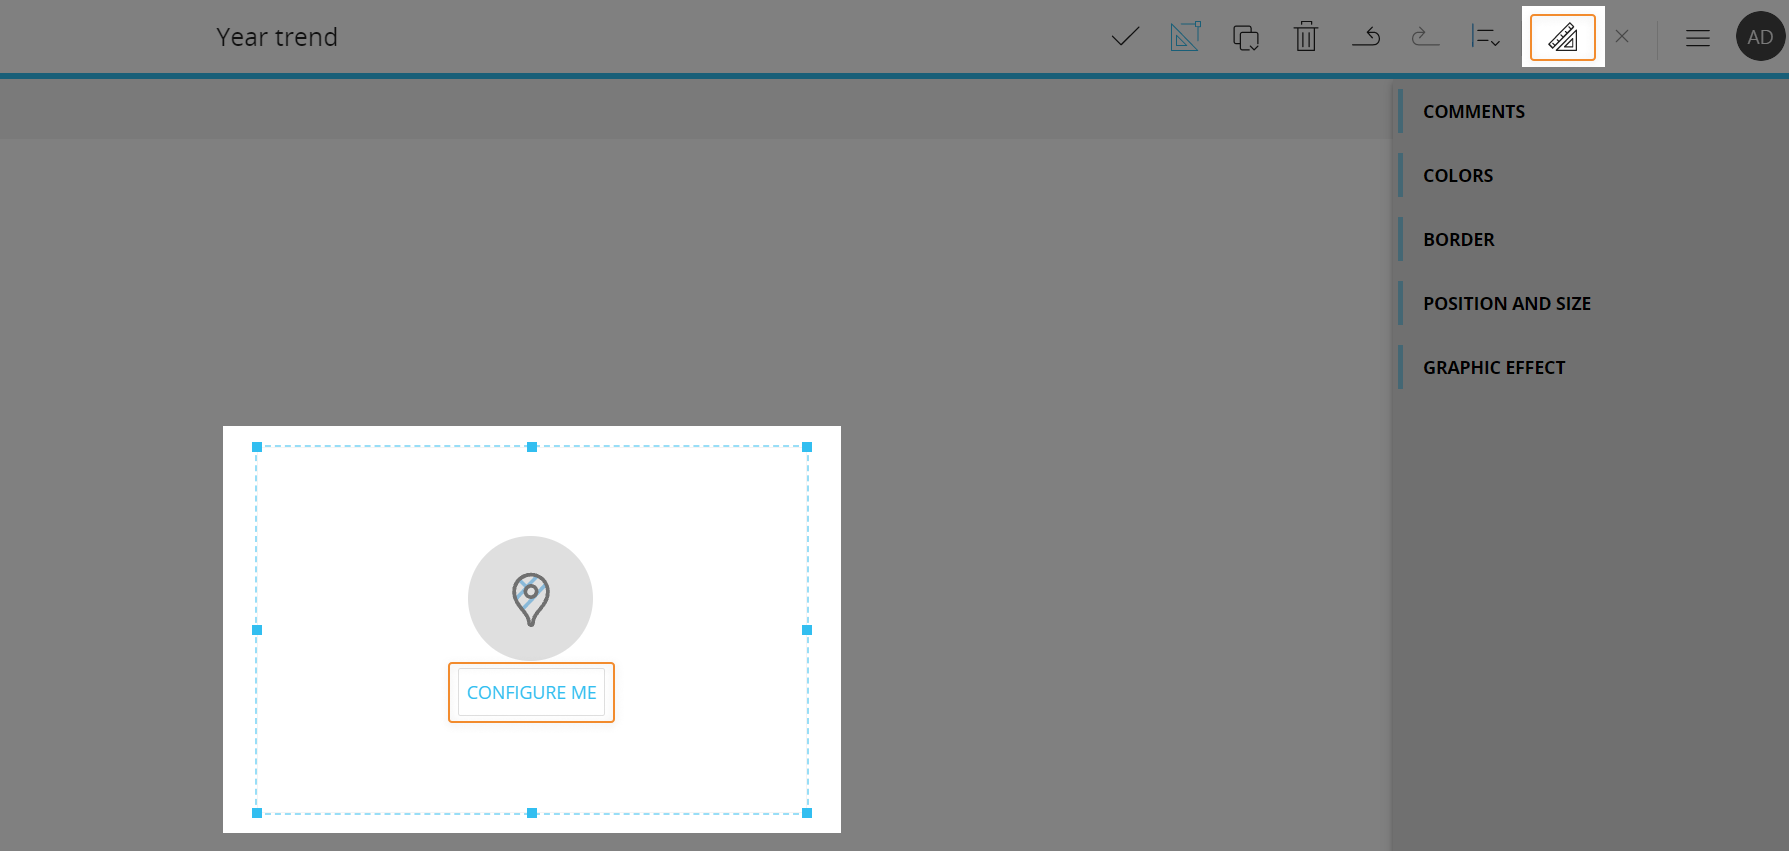
When you create a Google Maps Object, it is initially empty. The next step is to configure a Layout that will define the data to be displayed in the map. To do so, click the "Configure me" button or select the Object and click the "Configure layout" button (![]() ) located in the Top Menu of the Capsules workspace.
) located in the Top Menu of the Capsules workspace.
See The Layout Object, Configure a Layout and About data blocks of a Layout for more details on the Layout Object.
The Google Maps Object requires a valid Google Maps API key (a unique alphanumeric string) that can be obtained following the official Google guidelines.
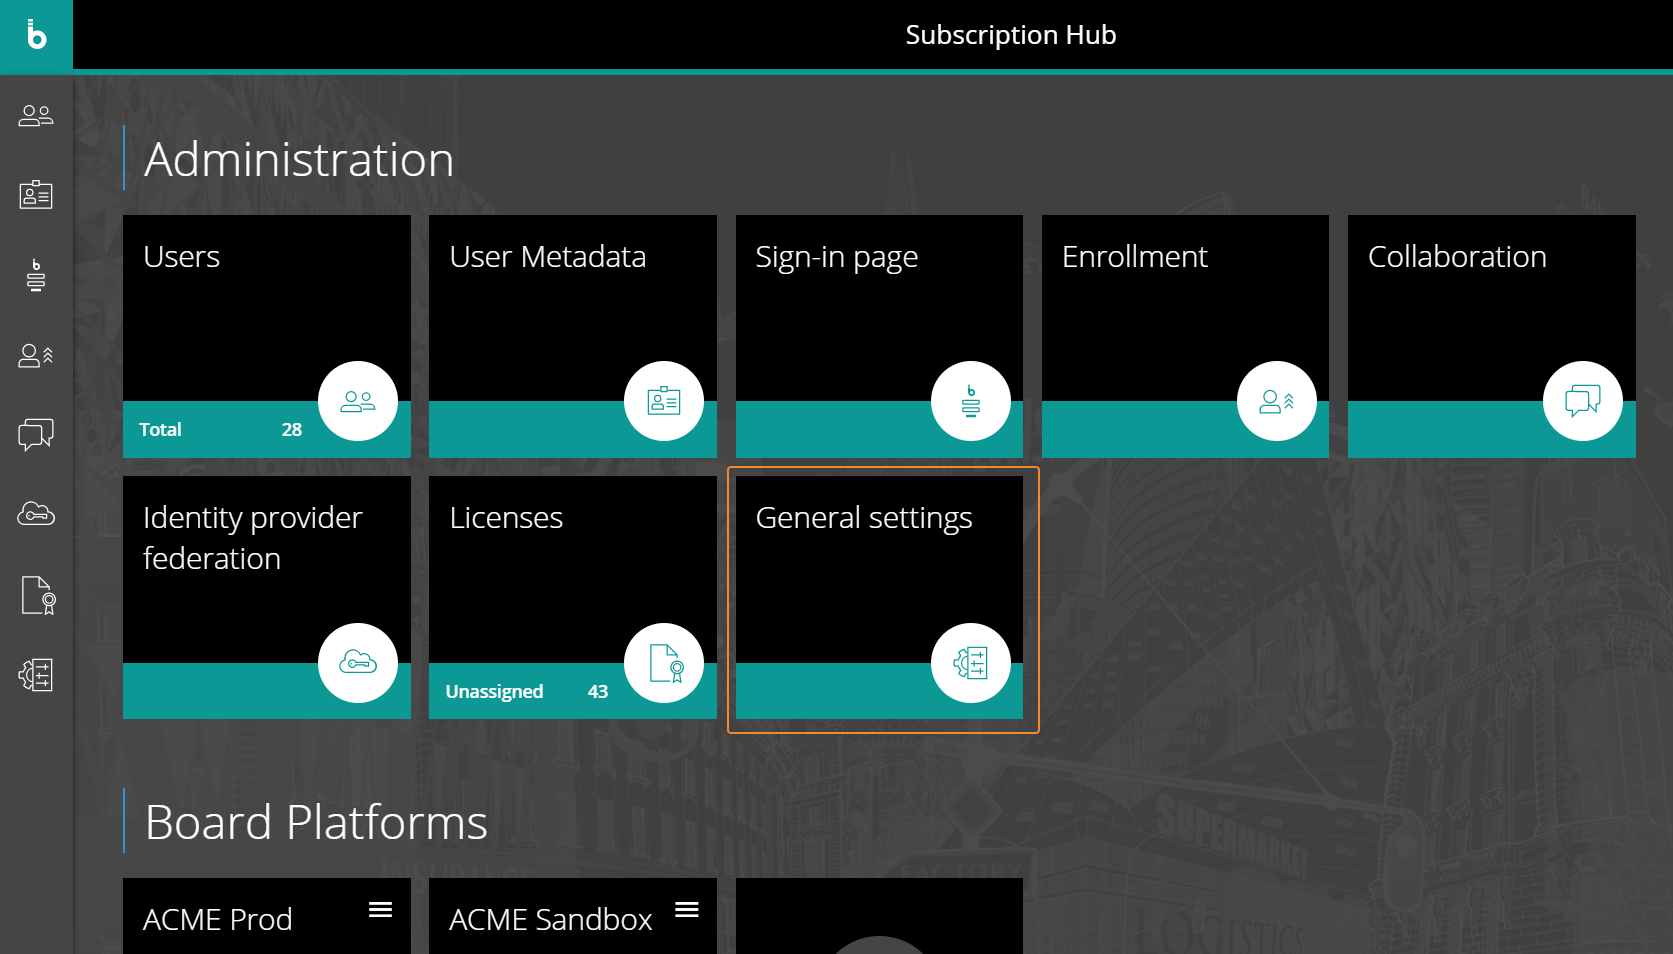
Once the API Key is created, Board Cloud customers will need to paste it in the "General settings" section of the Subscription Hub.
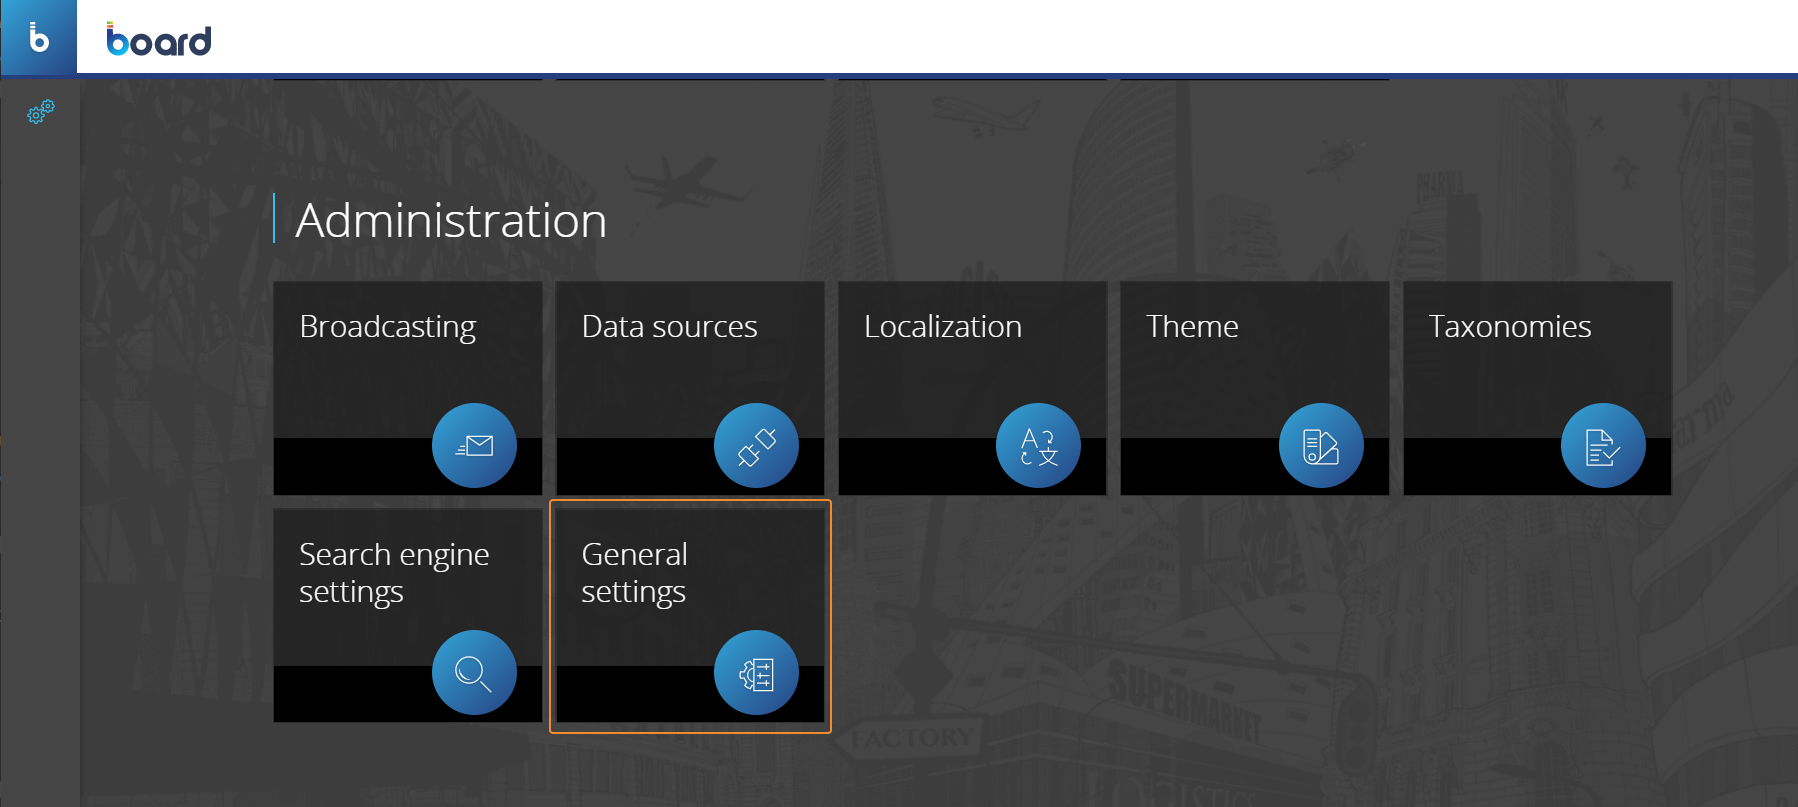
For on-premises installations, customers will need to paste their API key in the System Administration section of Board by clicking on the "General settings" tile.
The Google Maps Object, just like every other Object, can be moved, resized, duplicated via copy/paste and easily aligned with other Objects on the Screen.
See Configure Screen Objects for more details.
Google Maps Object Layout
The Layout editor for Google Maps Object is slightly different from the classic one, in that it offers map-specific options and must contain specific Data Blocks for mapping.
The main elements that should be considered are highlighted in the image below:
The Axis area
In the Axis area you can add dimensions to define markers that will be used to plot bubbles in the map or to highlight map areas.
The Google Maps Object supports up to 2 Entities in the "Markers" field.
For geocoding using Latitude and Longitude to work correctly, the dimension (Entity) used in the structure of Latitude and Longitude Cubes must be added to the "Markers" field as well. See next paragraph for more info.
For geocoding using an Entity/Text Block whose members/text strings are mapped to IDs of SVG areas in a GeoJSON file, you need to include the Entity/Text Block in the Layout and select it in the "Shape name" dropdown under the "Map Areas" menu. See Object properties and Upload GeoJSON for more details.
Base on the numbers of Entities set in the "Markers" field, two scenarios may occur:
- Standard data set (single Entity). The value is shown in the marker form. The position is given by Longitude and Latitude Cubes
- Clustered data set (two Entities). Data points are clustered together in Bubbles and relevant information related to the data point and the two Entities is displayed in a popover
The Data area
Geocoding can be achieved in two way via Data Blocks:
- Using Latitude and Longitude Cubes (for Map Areas and Bubbles. See Object properties for more details)
- Using an Entity/Text Block whose members/text strings are mapped to IDs of SVG areas in a GeoJSON file (only for Map areas. See Object properties for more details)
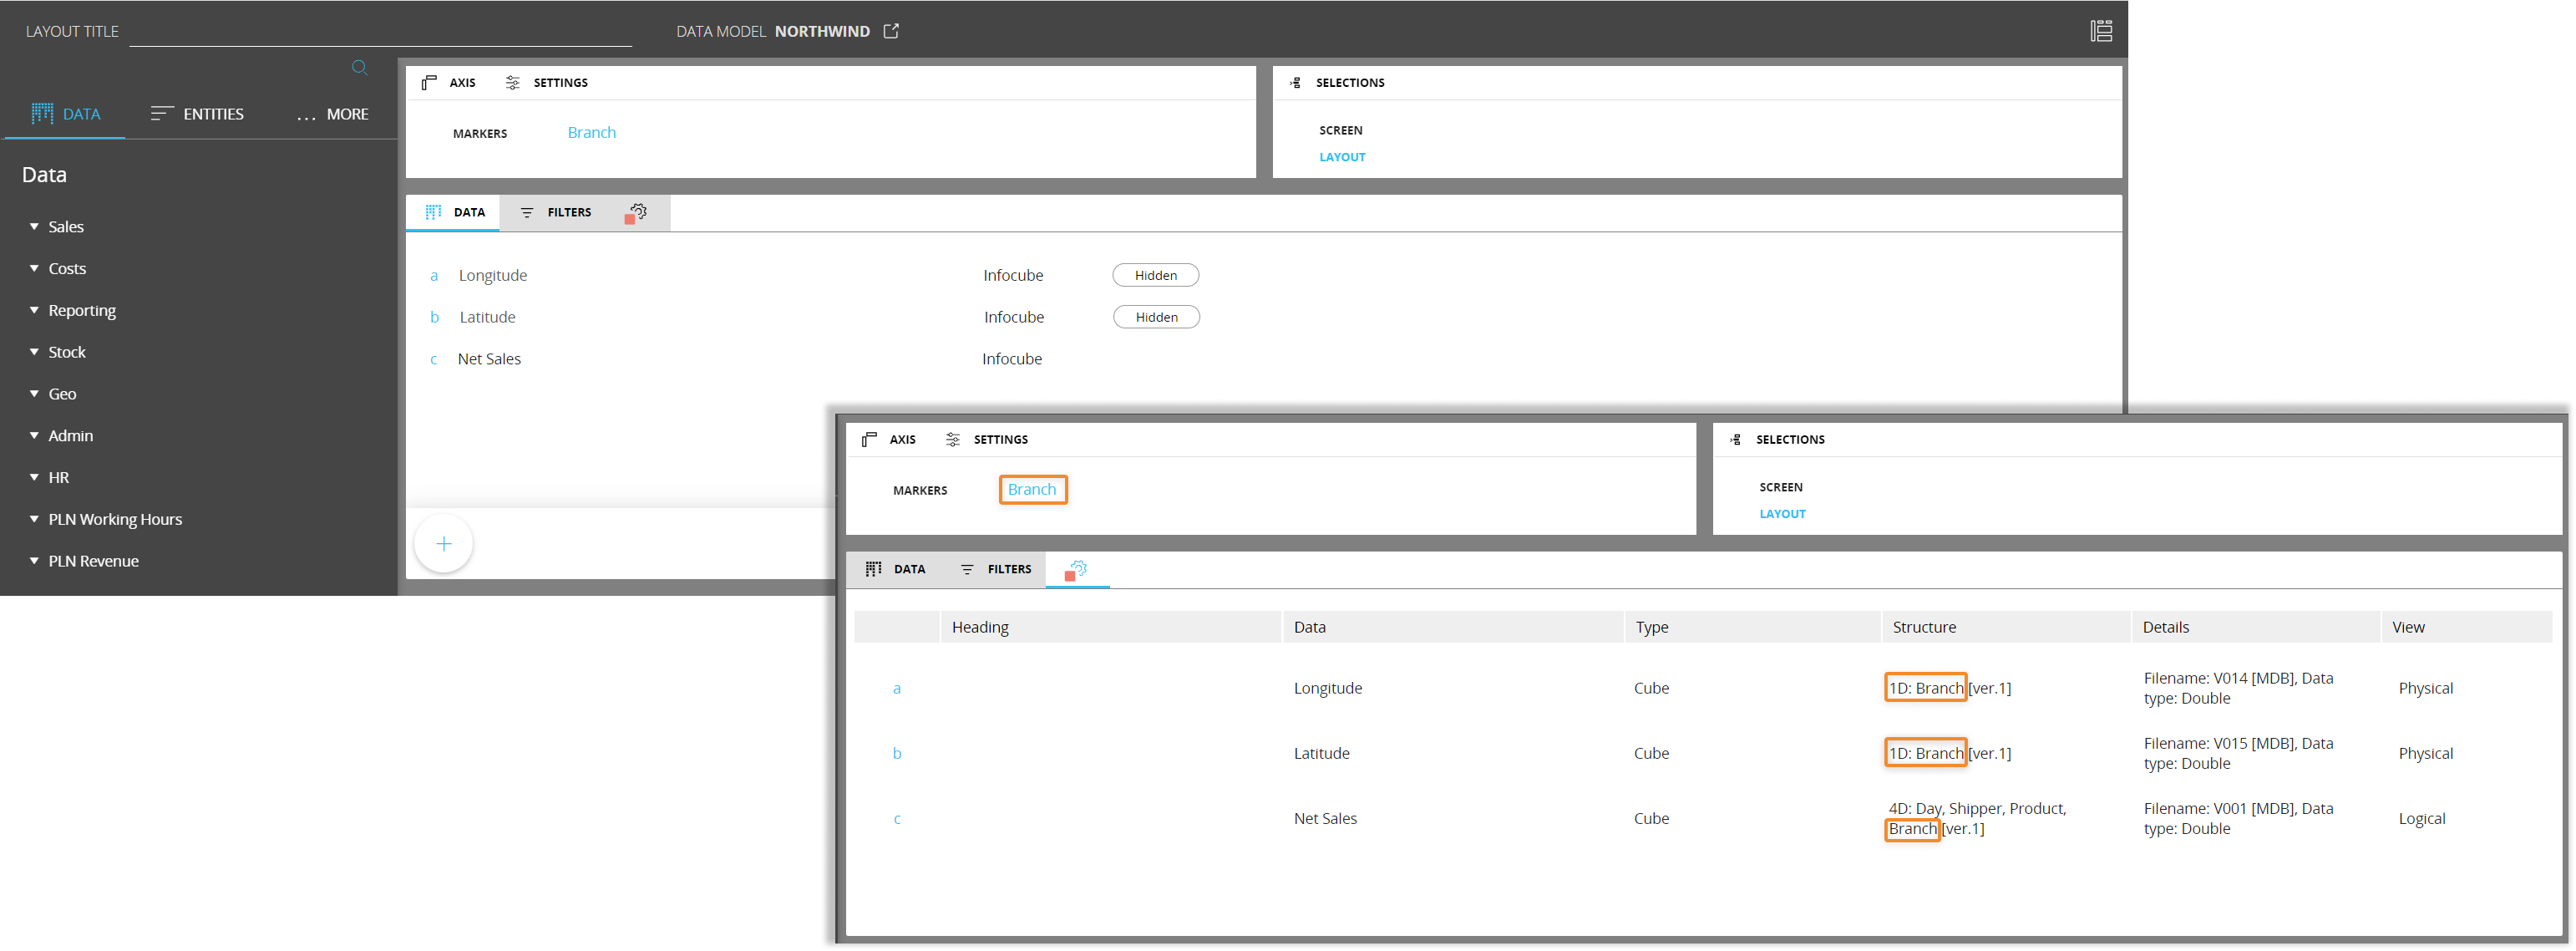
In the first scenario, the Google Maps Object requires the Latitude and Longitude Cubes to be added in the Data area of the Layout editor. These two Cubes must contain the geographic coordinates regarding members of the Entity added to the "Markers" field.
Data Cubes added to the Data area should also have the Entity added to the "Markers" field - or another Entity from the same Relationships tree - in their structure.
Example
You want to visualize data from your Net Sales Cube which is dimensioned by Day, Shipper, Product and Branch.
The Branch hierarchy is the following:
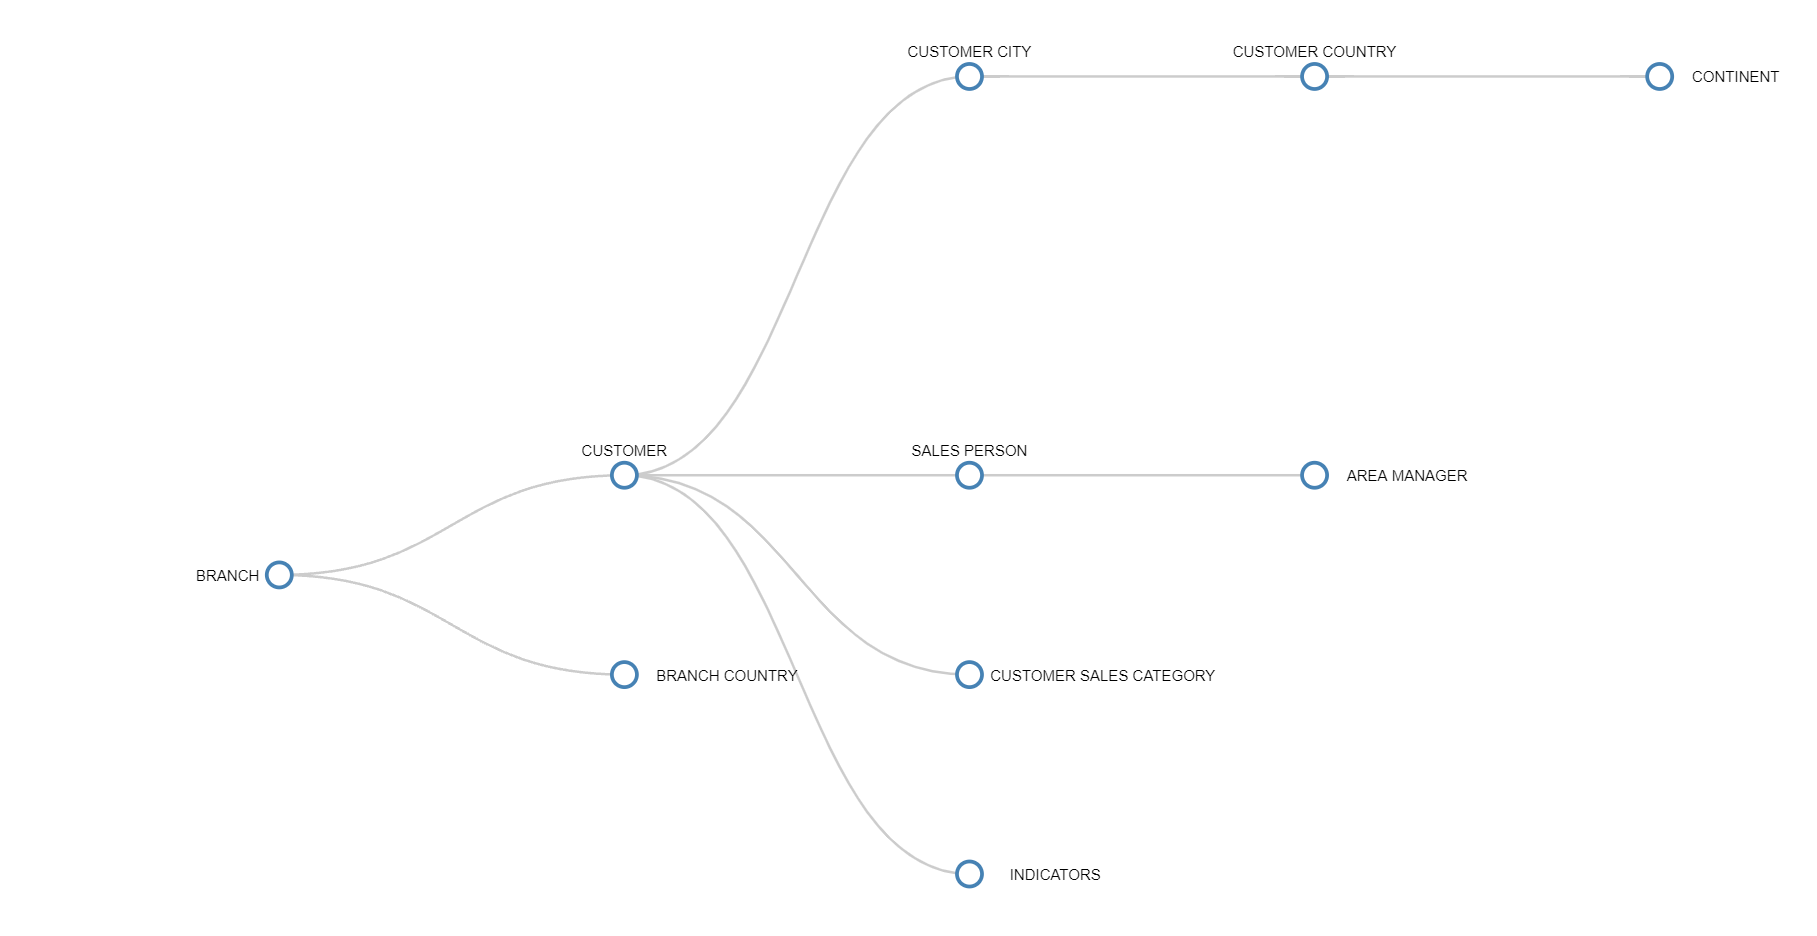
To plot your data in the Google Maps Object you need to add to your Layout two different Cubes dimensioned by Branch: one containing Latitude coordinates and the other one containing Longitude coordinates of each member of the Branch Entity.
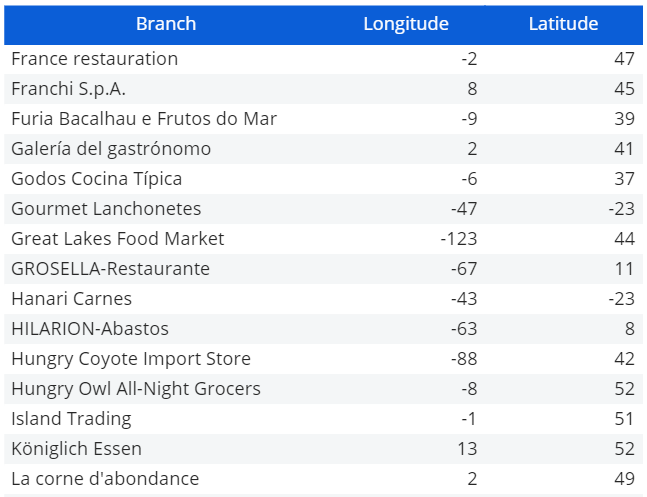
The following Data View shows those coordinates for each member of the Branch Entity.
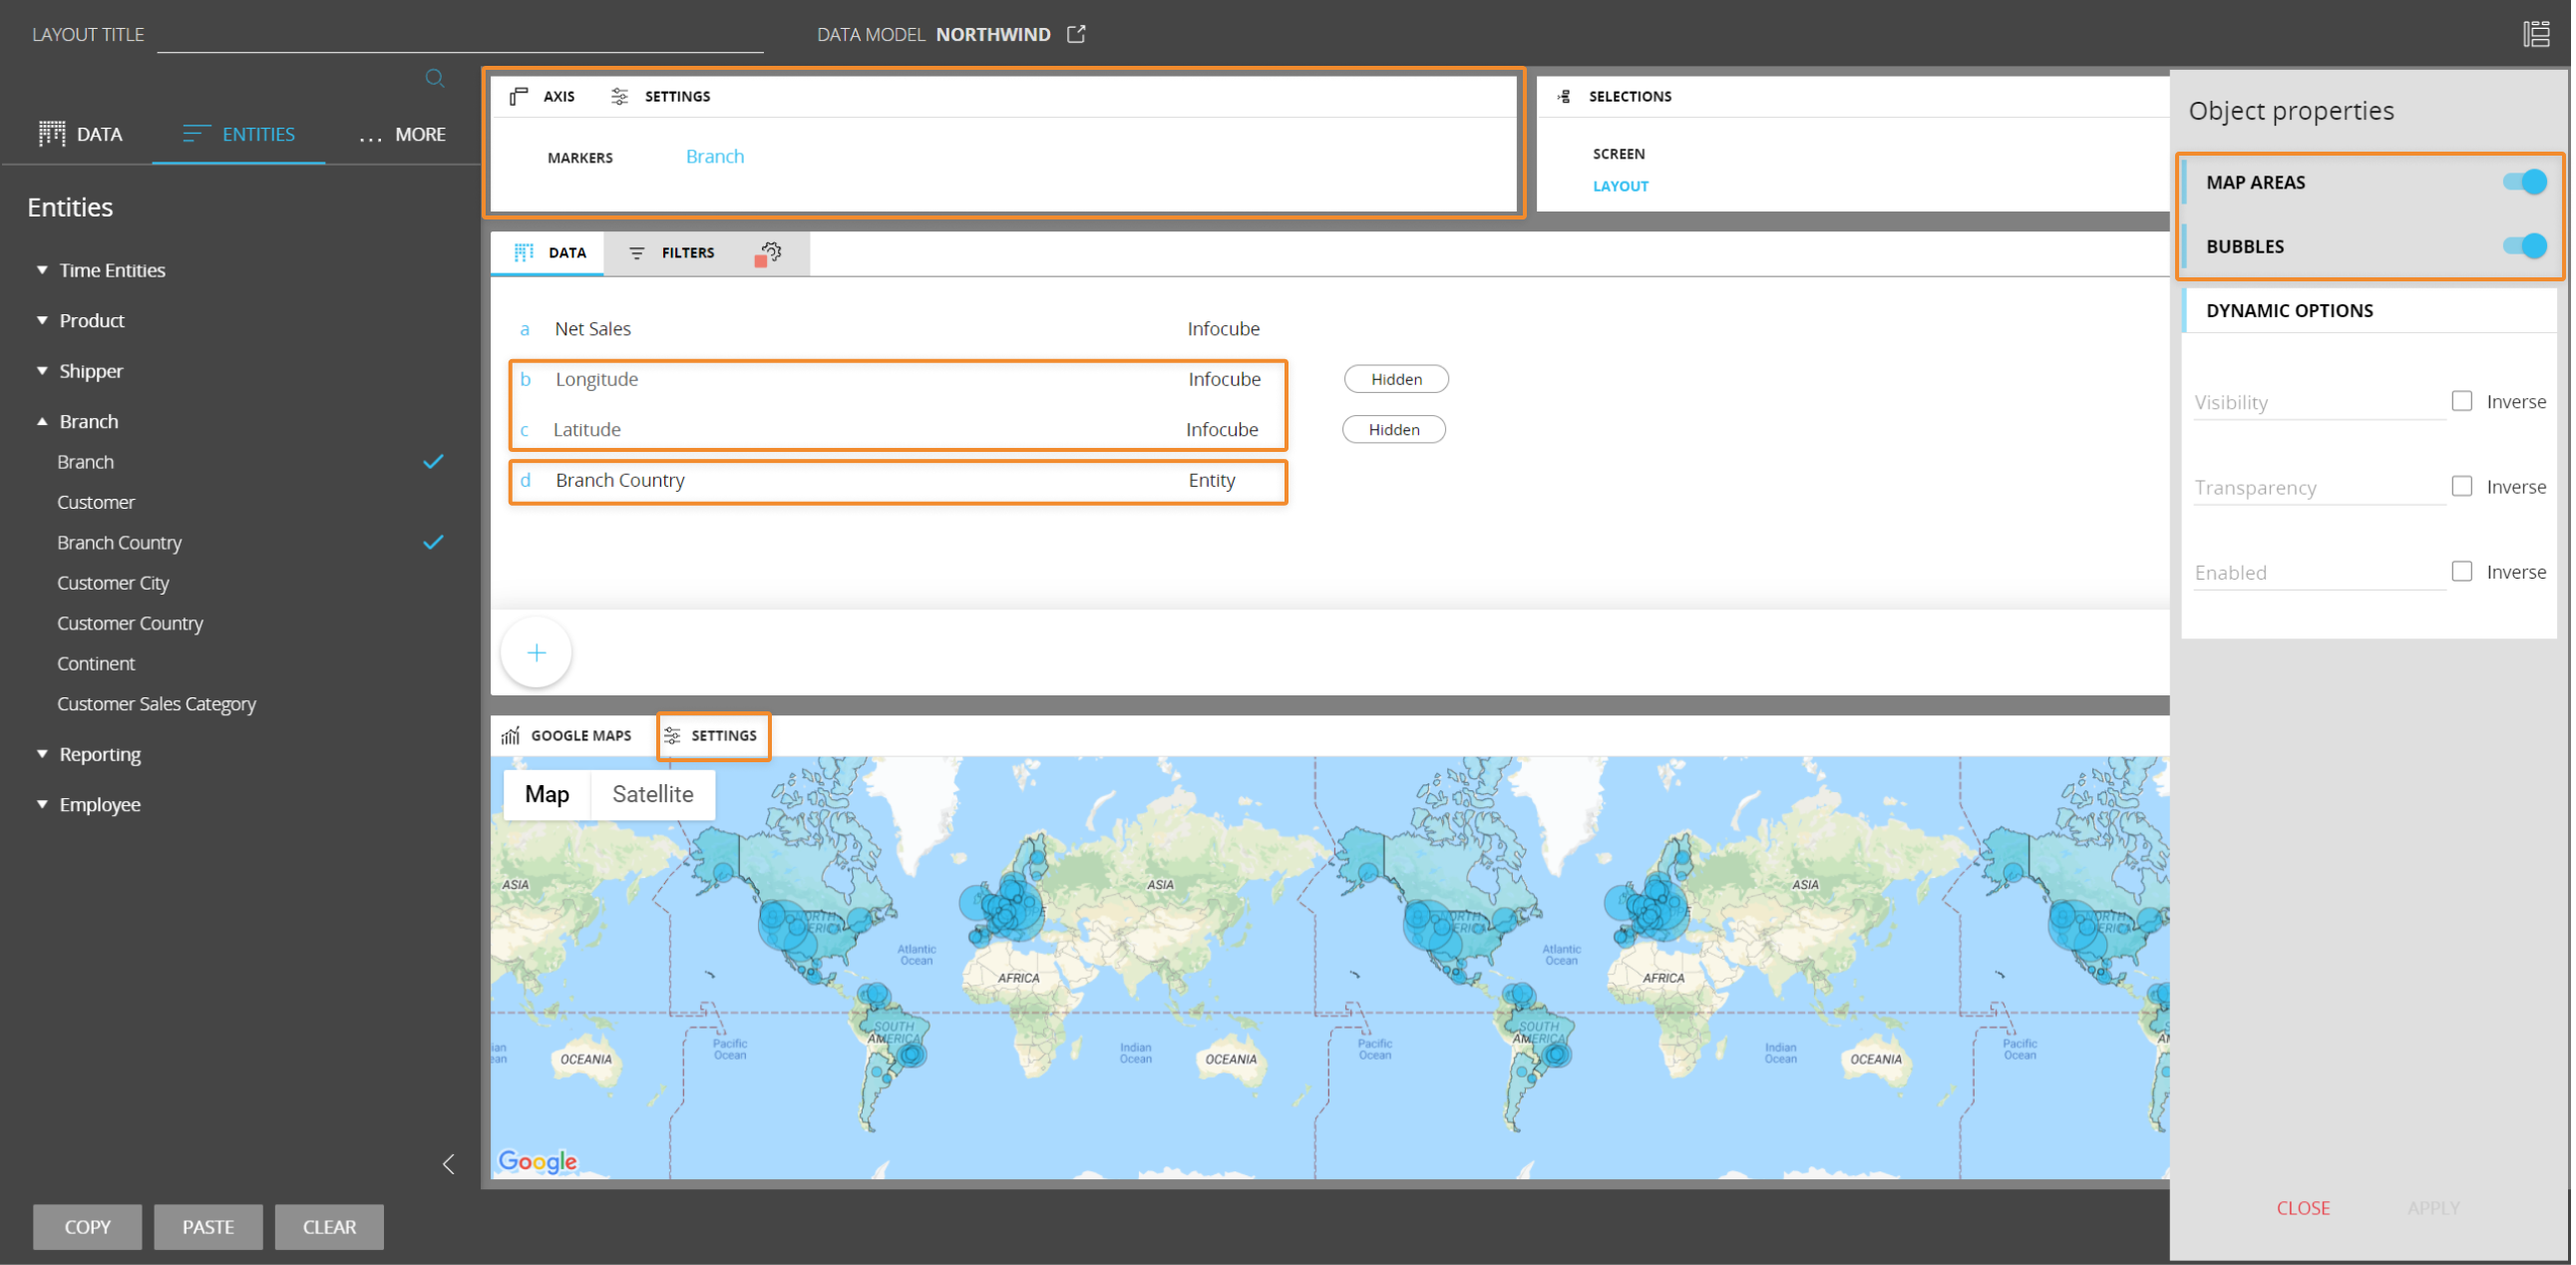
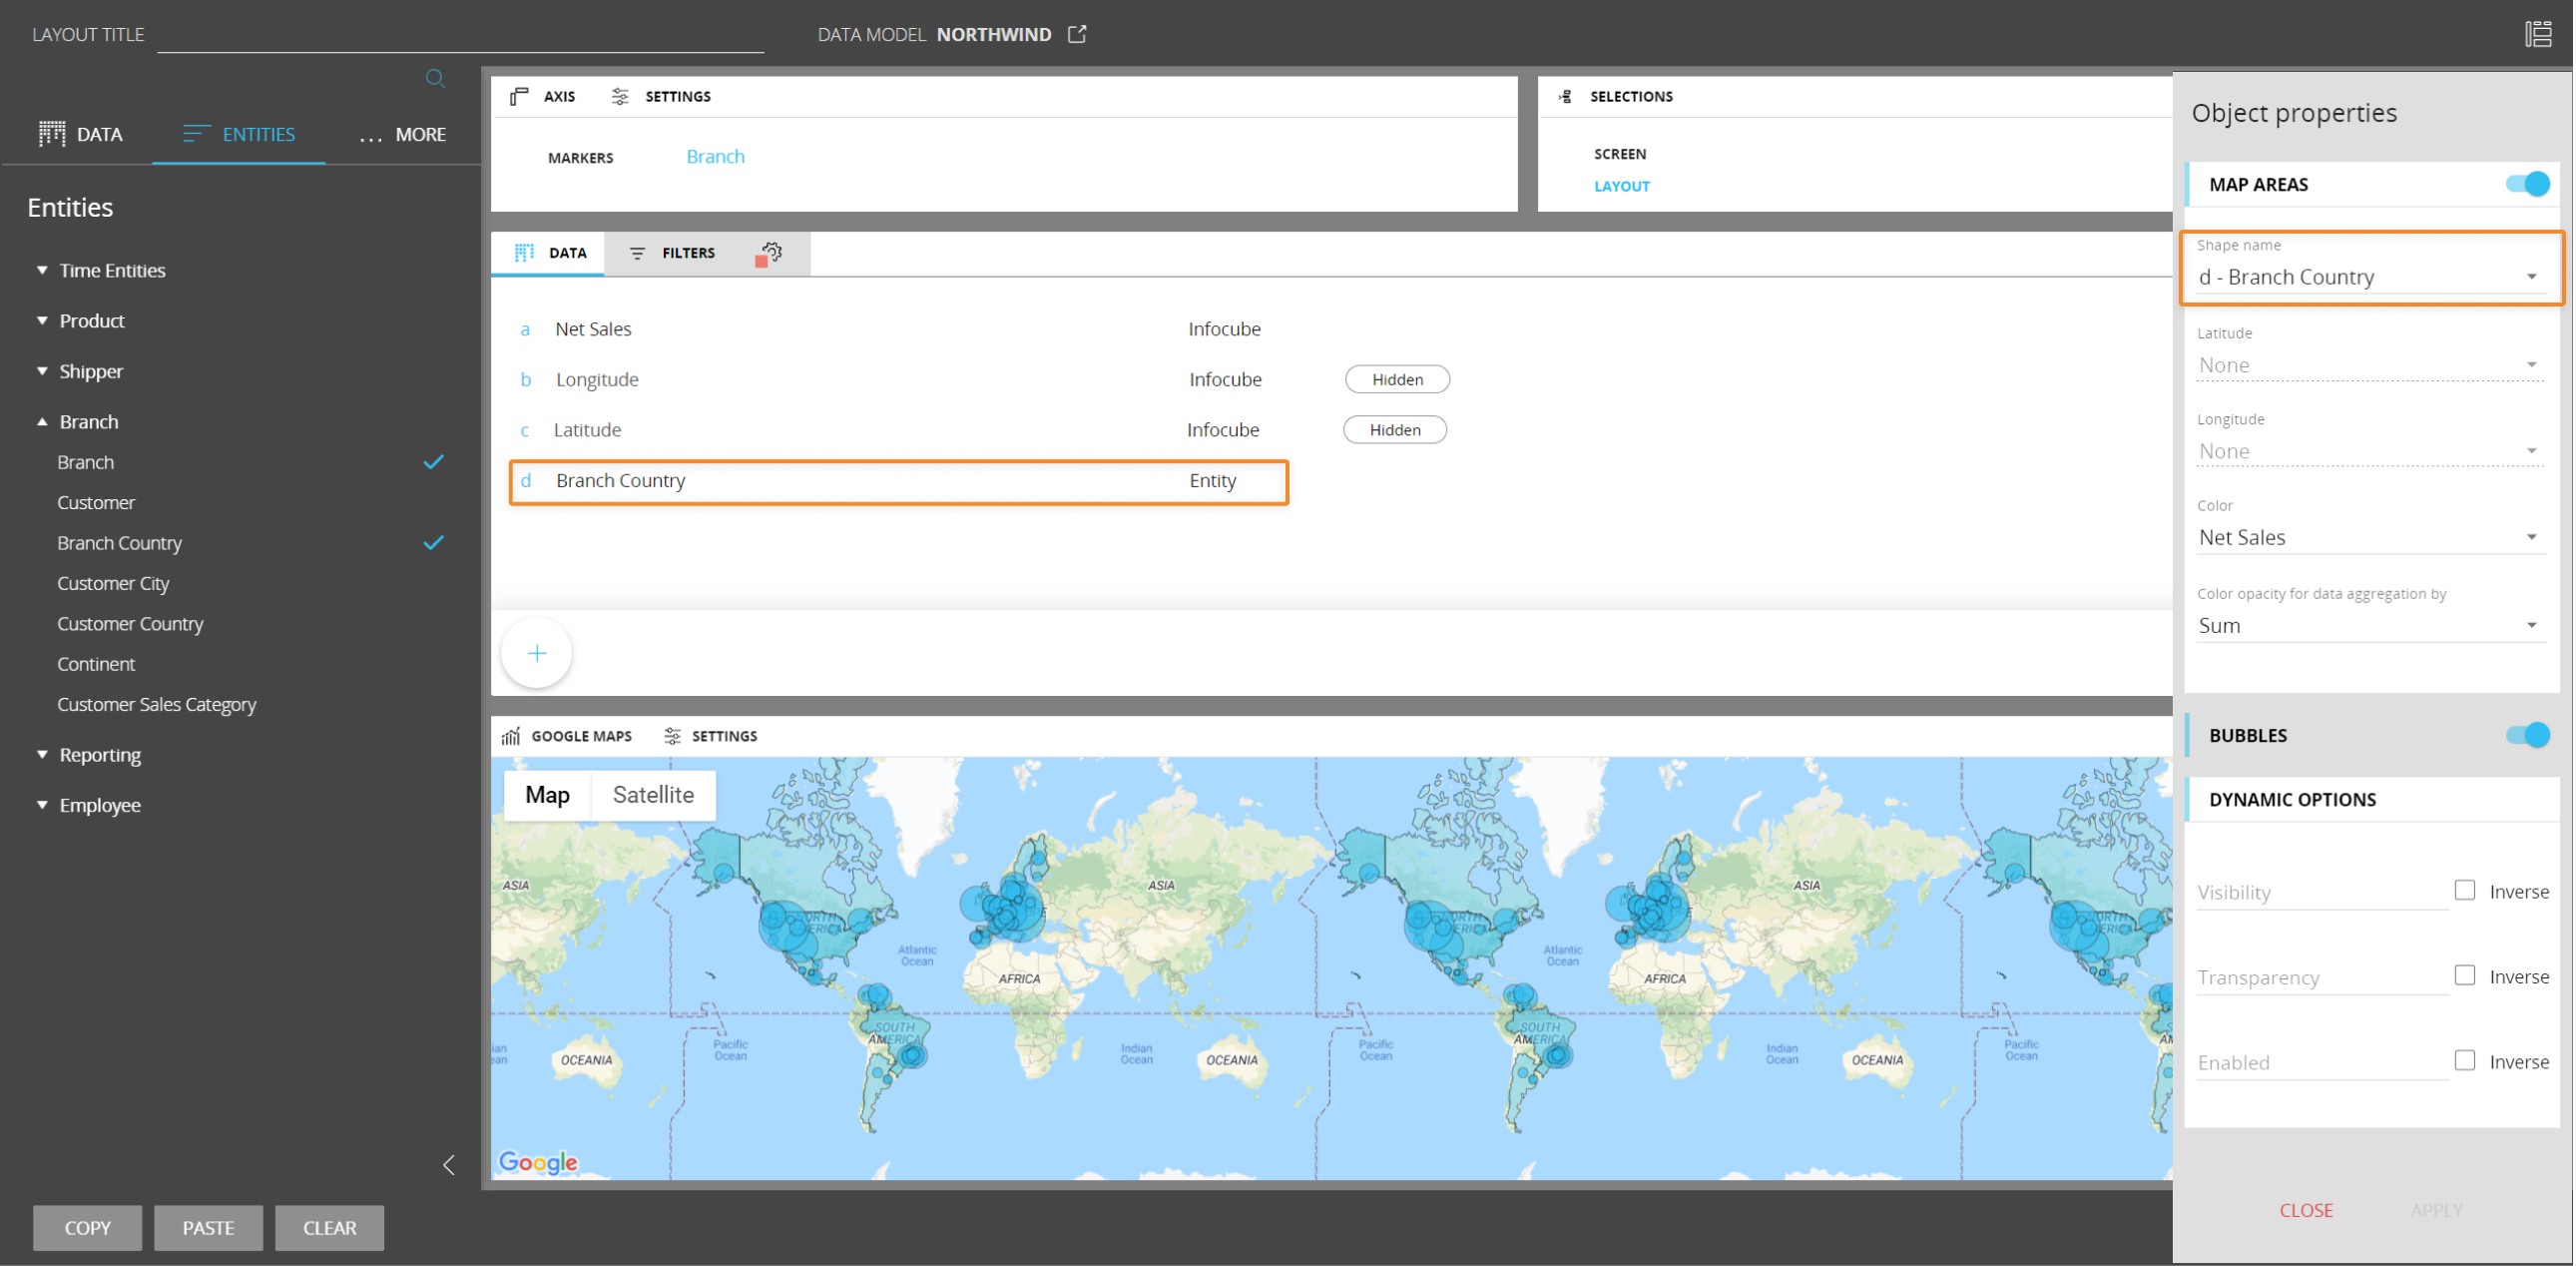
The following Layout definition will then visualize your data on the map, provided you have configured Bubbles and Map Areas in the Object Properties panel (see next paragraph for more info):
As you can see in the example above, the Branch Entity is in the "Markers" field and all Cubes in the Layout have the Branch Entity in their structure.
Data Cubes must have in their structure the Entity added to the "Markers" field or another Entity from the same Relationships tree at any level of aggregation.
To obtain geographical data, you can use various online providers (free or paid) or enter those values yourself through data-entry actions in corresponding Cubes.
In the second scenario, an Entity/Text Block whose members/text strings are mapped to IDs of SVG areas in a GeoJSON file must be added to the Layout. Then, you have to select it in the "Shape name" dropdown under the "Map Areas" menu in the Object properties panel.
The GeoJSON file must contain IDs and coordinates for each map area while the Entity/Text Block in the Layout must contain the same IDs as member codes (Entity) or text strings (Text Block).
Data Cubes added to the Data area should also have the Entity added to the "Markers" field - or another Entity in the same Relationships tree - in their structure.
Example
You want to visualize data from your Net Sales Cube which is dimensioned by Day, Shipper, Product and Branch.
The Branch hierarchy is the following:
To plot your data in the Google Maps Object you need to add to your Layout an Entity/Text Block containing the IDs of the SVG areas included in the GeoJSON file you want to use. Then you will need to map the Block containing the IDs to the GeoJSON file, from the "Map Areas" menu in the Object properties panel.
Using an Entity, the Layout configuration should look as follows:
The Branch Country Entity contains the following members, whose code is also used to identify map areas in the GeoJSON file:
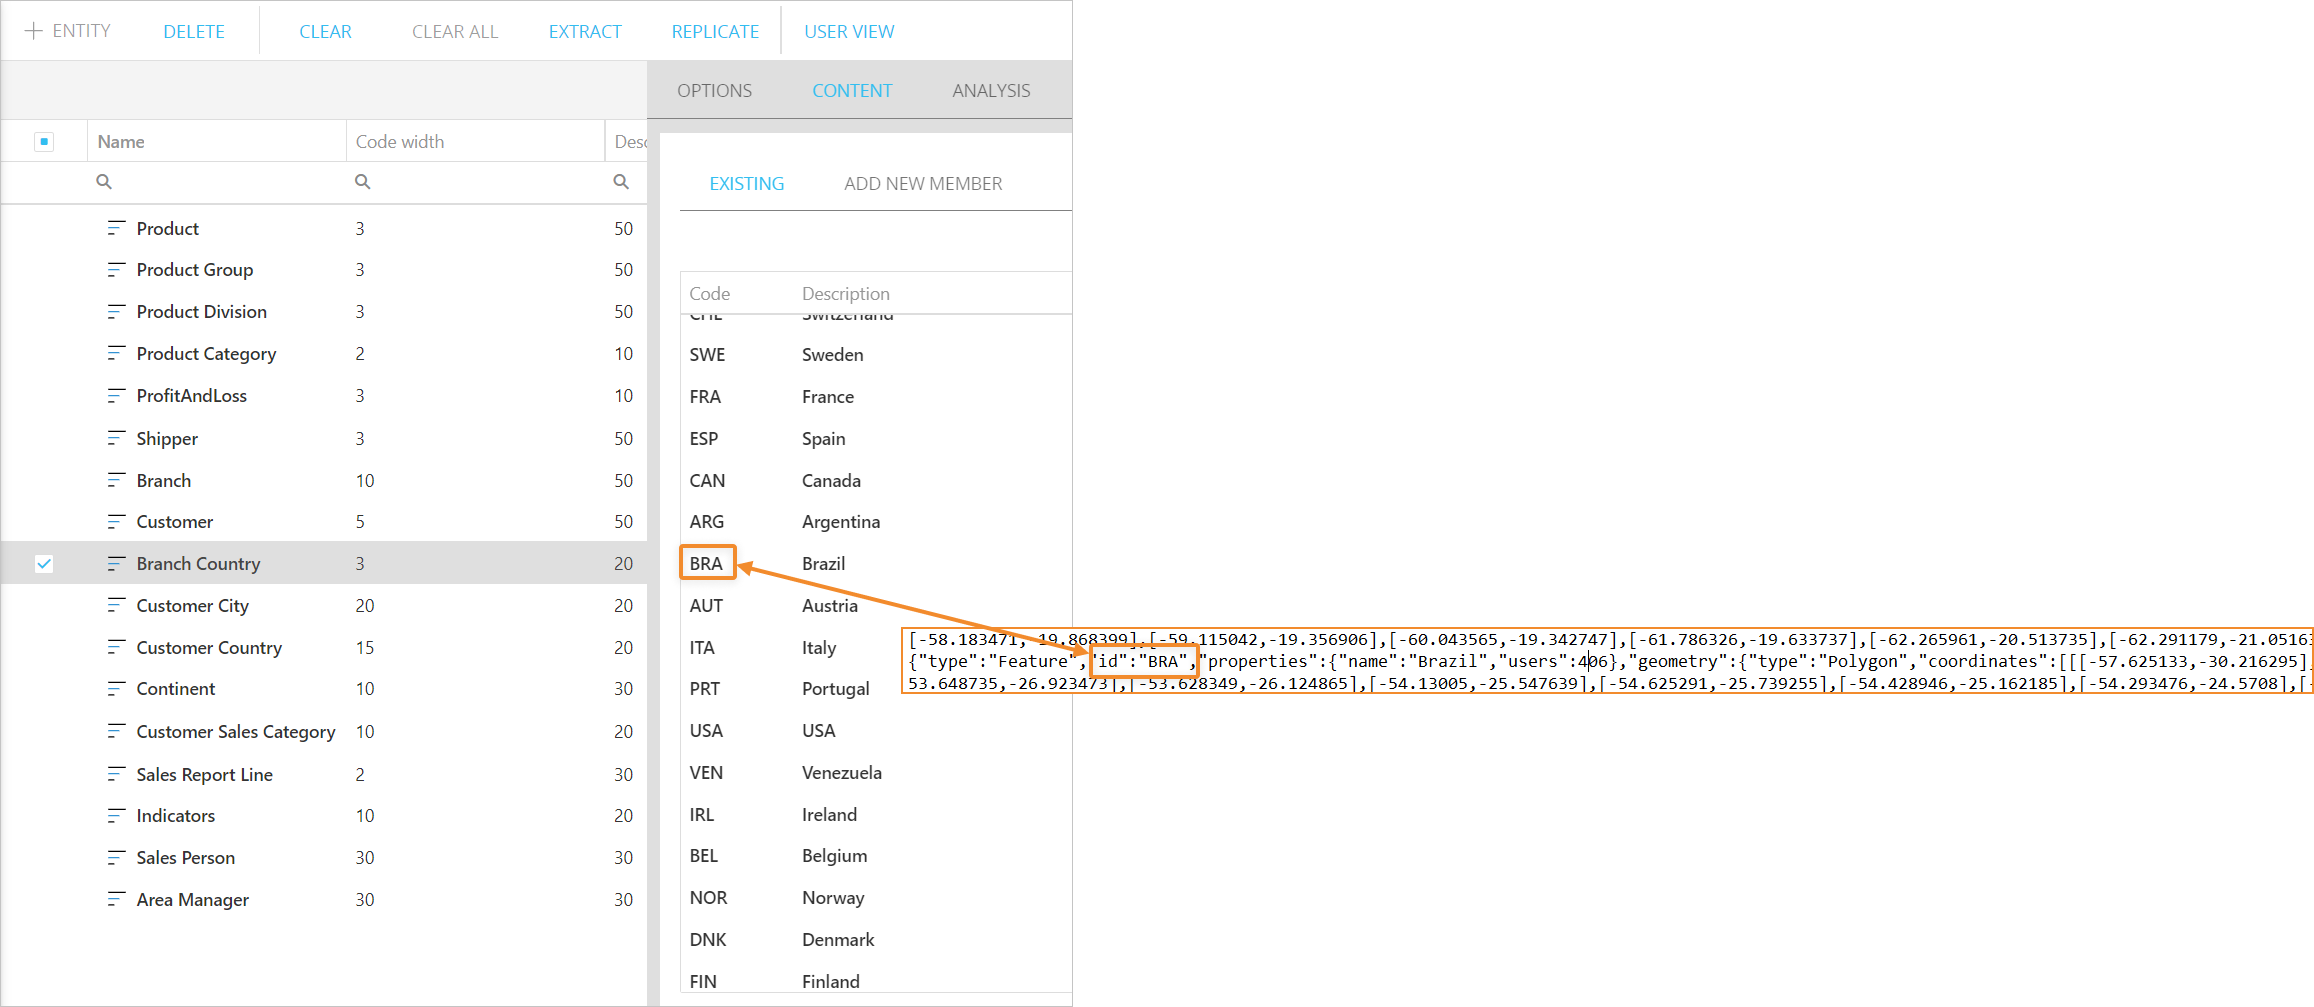
Data Cubes must have in their structure the Entity added to the "Markers" field or another Entity from the same Relationship tree at any level of aggregation.
Object properties
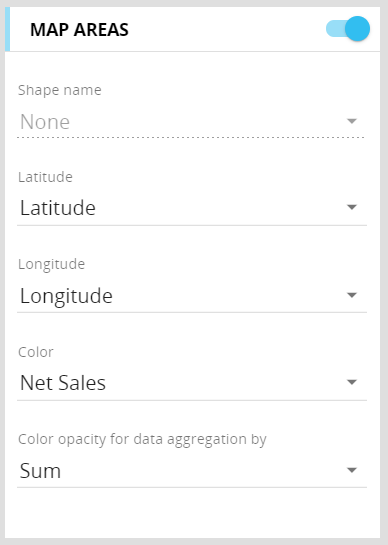
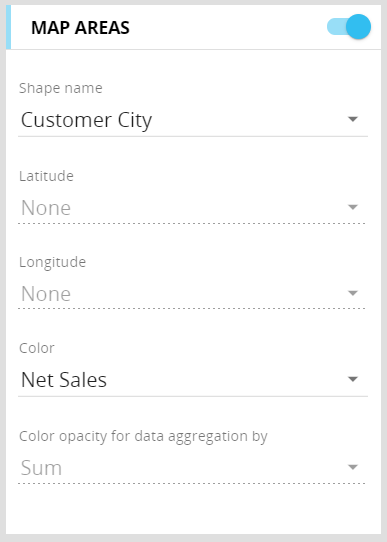
In the Layout editor, under the Object properties panel, the "Map areas" menu allows you to configure data visualization as a colored layer over relevant map areas.
The configuration can be done using Latitude and Longitude Cubes OR by mapping the Entity/Text Block to the ID of the SVG areas in the GeoJSON file via the "Shape name" field. For both options, in the "Color" dropdown menu you can select Blocks from the Layout and use them as drivers for the area's color, while the "Color opacity for data aggregation by" dropdown menu allows you to define a criterion that controls the color opacity.
The following examples show the two mapping options available.
If you select multiple Blocks in the "Color" dropdown list, they will also appear in the contextual menu (sliding toolbar) both in Design and Play mode under the "Shapes" dropdown list: from there, just select the Block you want to be used as driver for the map areas color.
The "Bubbles" menu allows you to configure Bubbles that will be plotted on the map using Latitude and Longitude Cubes in the Layout. You can also define which Blocks will be used as drivers for the Bubbles radius and color.
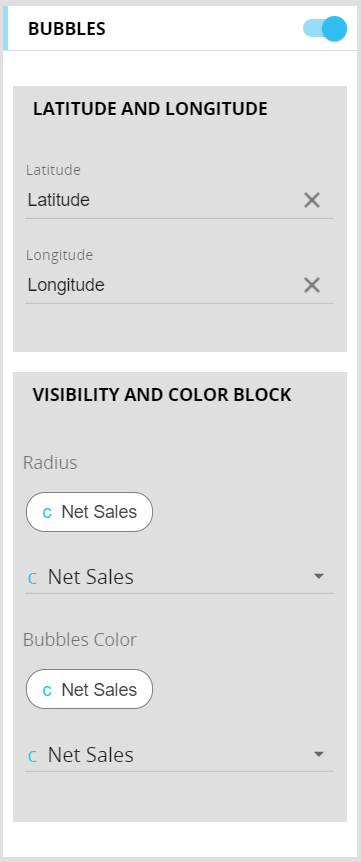
You can configure the Bubbles color to change dynamically by setting a color alert on the corresponding Block. See Block settings for more details.
If both the Bubbles and Map areas option are enabled, setting a color alert on the Block that drives the color setting for both options will apply the alert settings to Bubbles and Map areas.
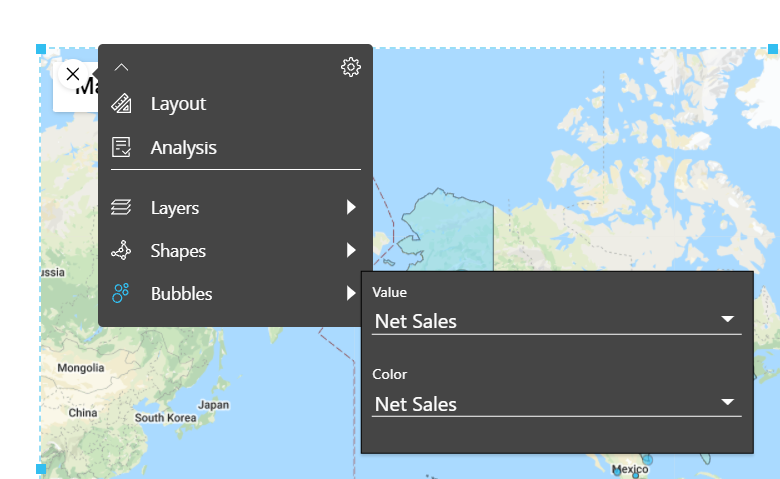
If you select multiple Blocks in the "Radius" and "Bubbles Color" dropdown lists, they will also appear in the contextual menu (sliding toolbar) both in Design and Play mode under the "Bubbles" dropdown list: from there, just select the Block you want to be used as driver for the Bubbles color and Radius (Value).
Google Maps properties and settings
Google Maps properties are available from the contextual right panel of the Screen editing page once the Object is selected and it's associated with a Layout.
The Google Maps Object supports all options common to all Screen Objects and the following properties:
- Master object. If enabled, clicking on a marker or a map area will update the data displayed by all other Objects on the Screen in order to show only the data relating to the clicked item. The Master object result is similar to applying a Screen Selection
- Disable Drill down. Disables the drill-down functionality, both in Design and Play mode
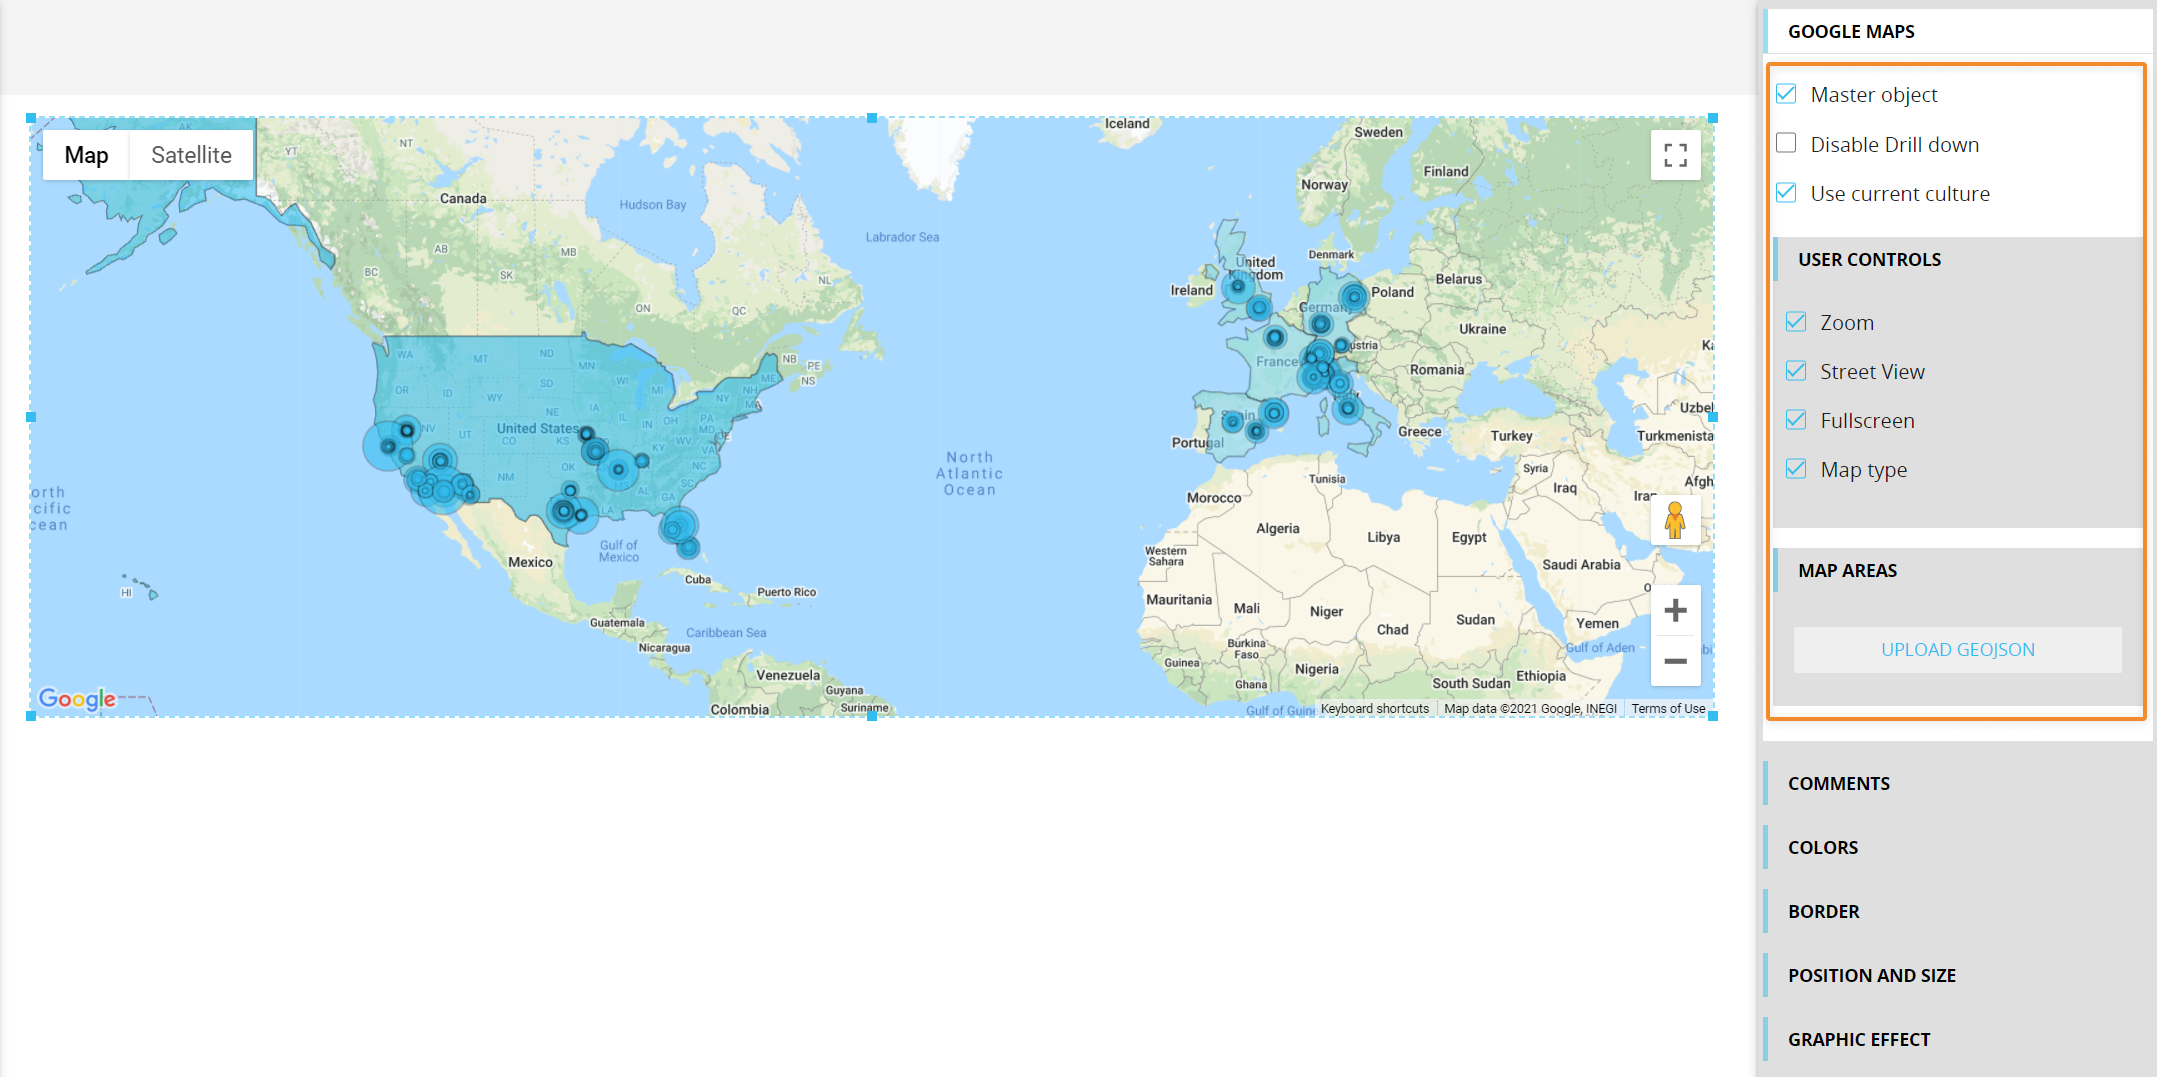
The following options allow you to define how users will be able to interact with the Google Maps Object:
- Use current culture. Applies your current culture to the map. All users will see the map with those settings applied
- Under the "USER CONTROLS" menu:
- Zoom. Enables the Zoom control for changing the zoom level of the map. As you zoom out, markers of close proximity will consolidate into clusters, thus simplifying the display of markers on the map
- Street View. Enables the Street View control for showing a Pegman icon which can be dragged onto the map to enable Street View
- Fullscreen. Enables the Fullscreen control that offers the option to open the map in fullscreen mode
- Map type. Enables the Map Type control, allowing the user to choose a map type
The "UPLOAD GEOJSON" button allows you to upload a GeoJSON file to manage map areas at different levels of detail.
To do so, proceed as follows:
- Click on the button. The GeoJSON configuration window appears:
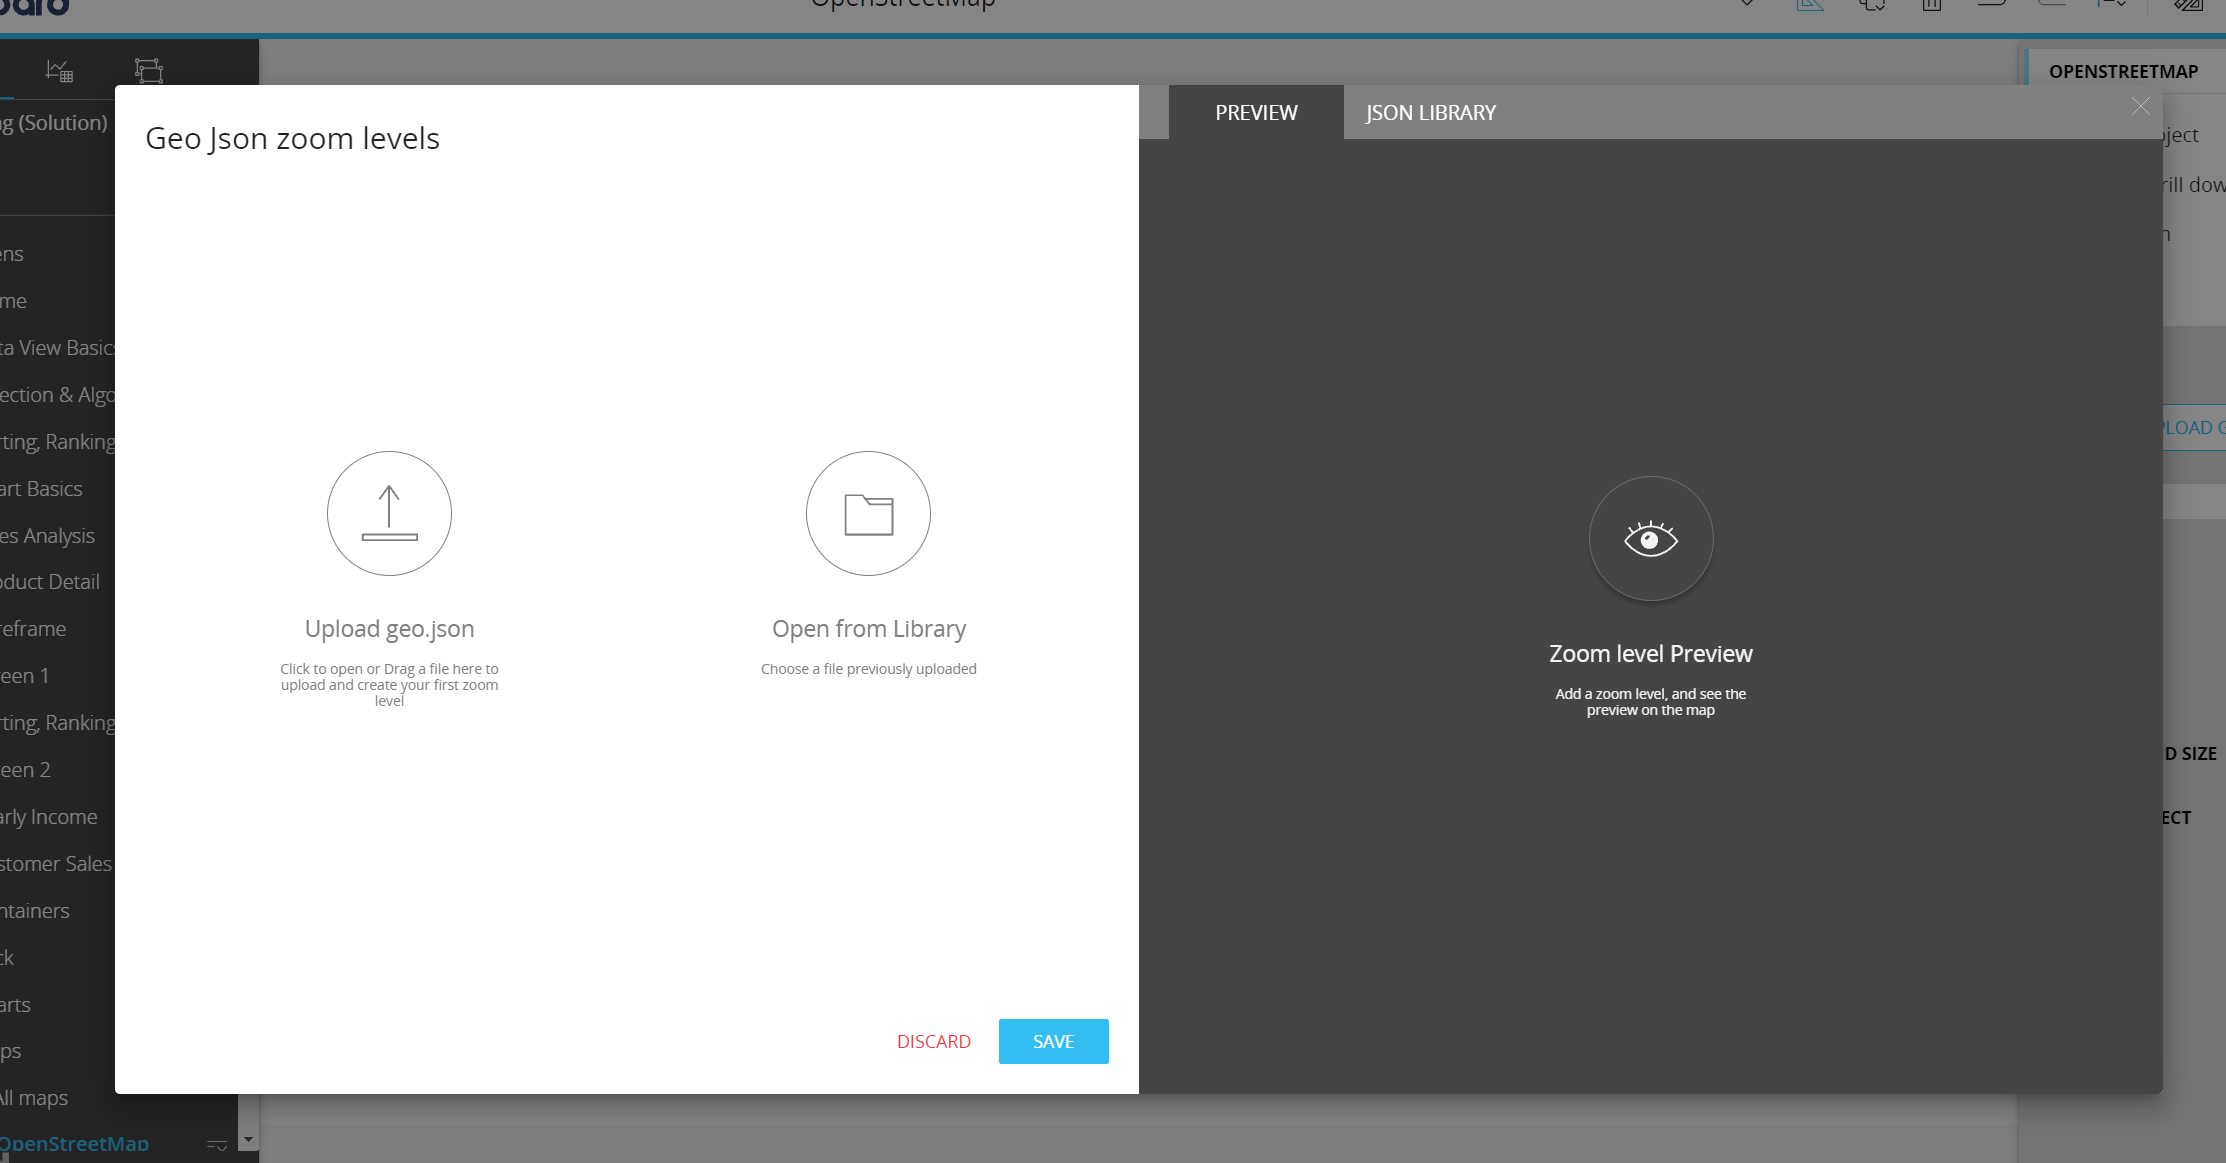
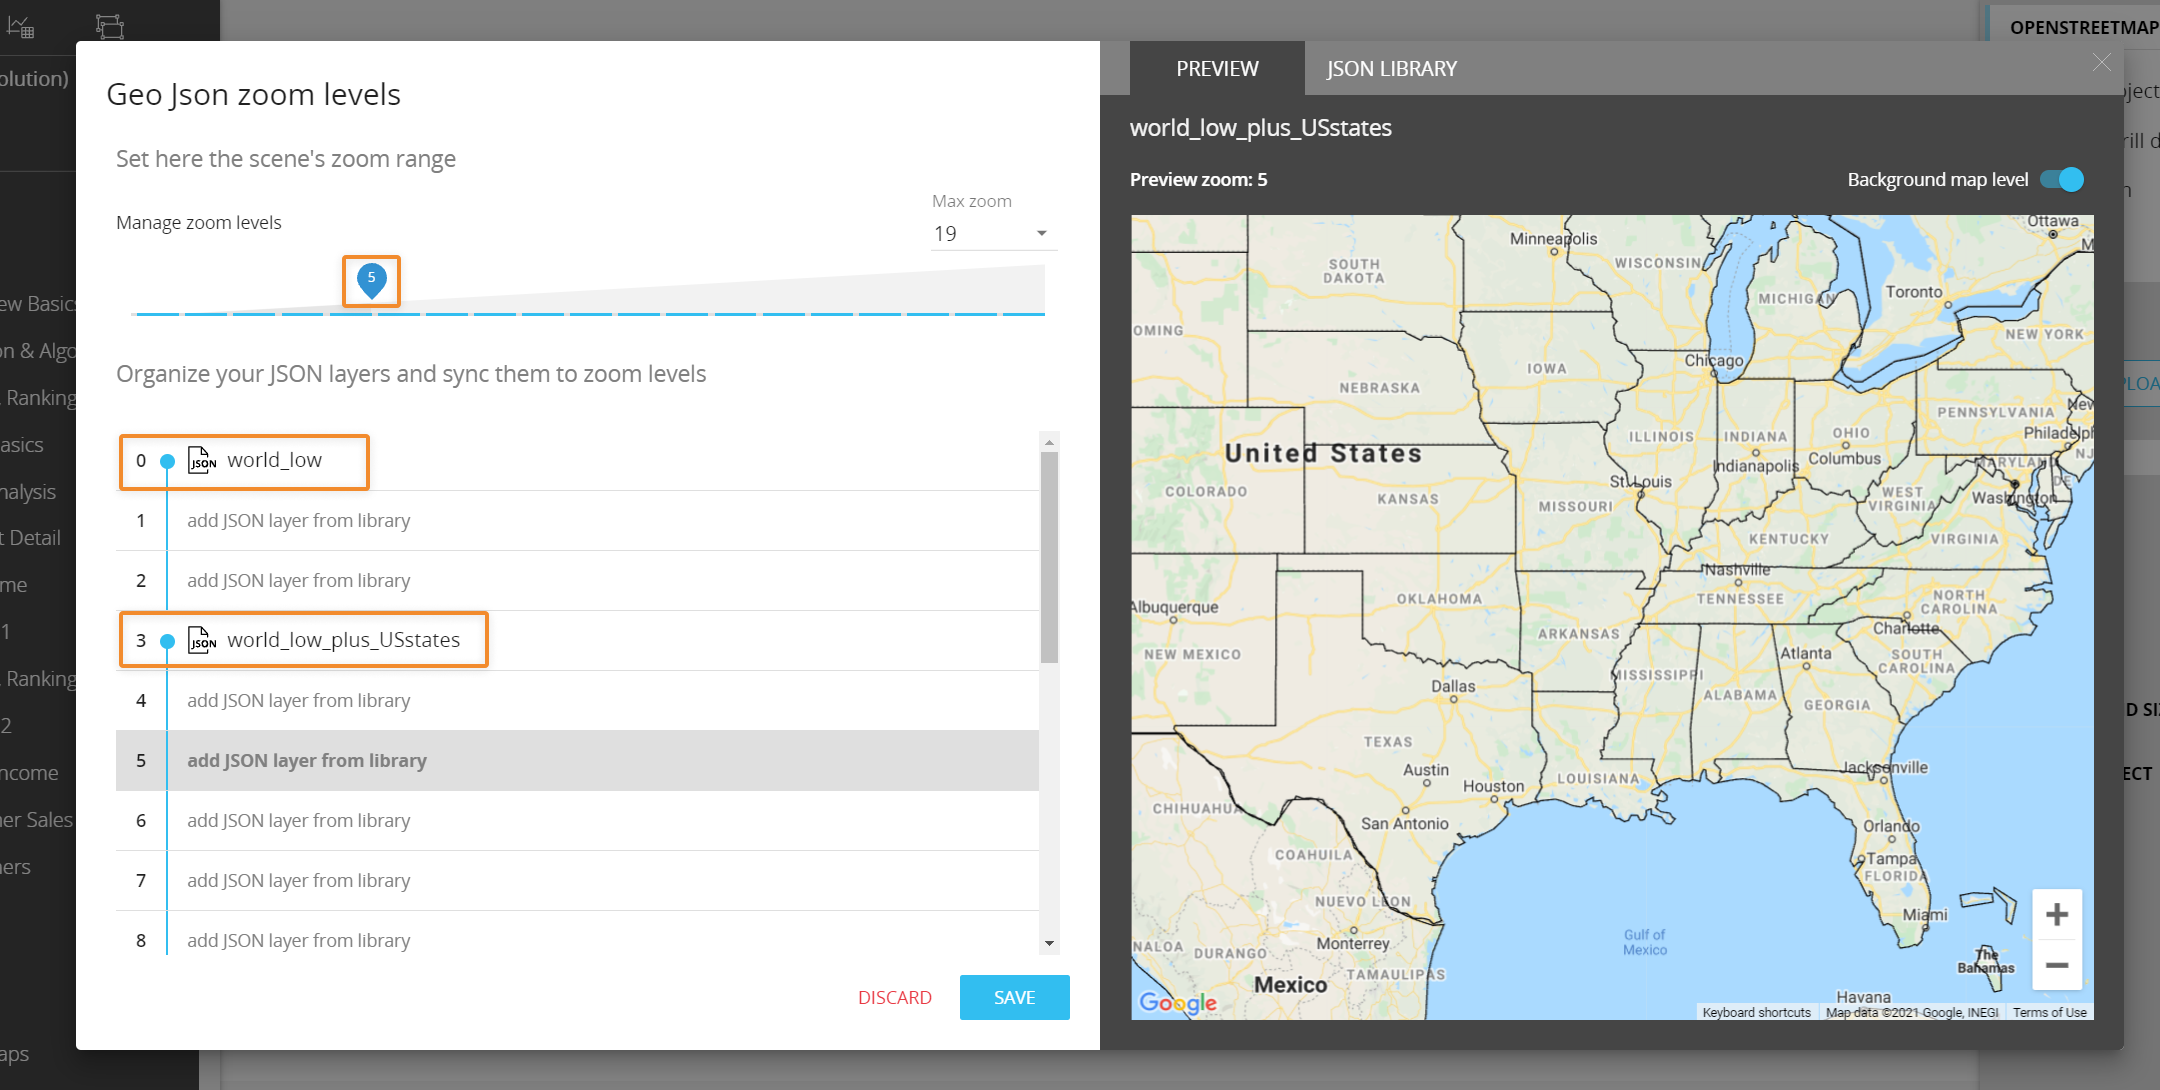
From there you can upload one or more GeoJSON files to create your Library that will always be available for all Google Maps configurations - Once you've uploaded your files (or selected a previously uploaded file from the Library), you can set the maximum zoom level (from 0 to 19) and associate each level with the available GeoJSON files.
Board includes two out-of-the-box GeoJSON files, one for the entire world to be used at zoom level 0 and one for US States to be used at higher zoom levels.
-
Click the SAVE button to save your configuration and close the window.
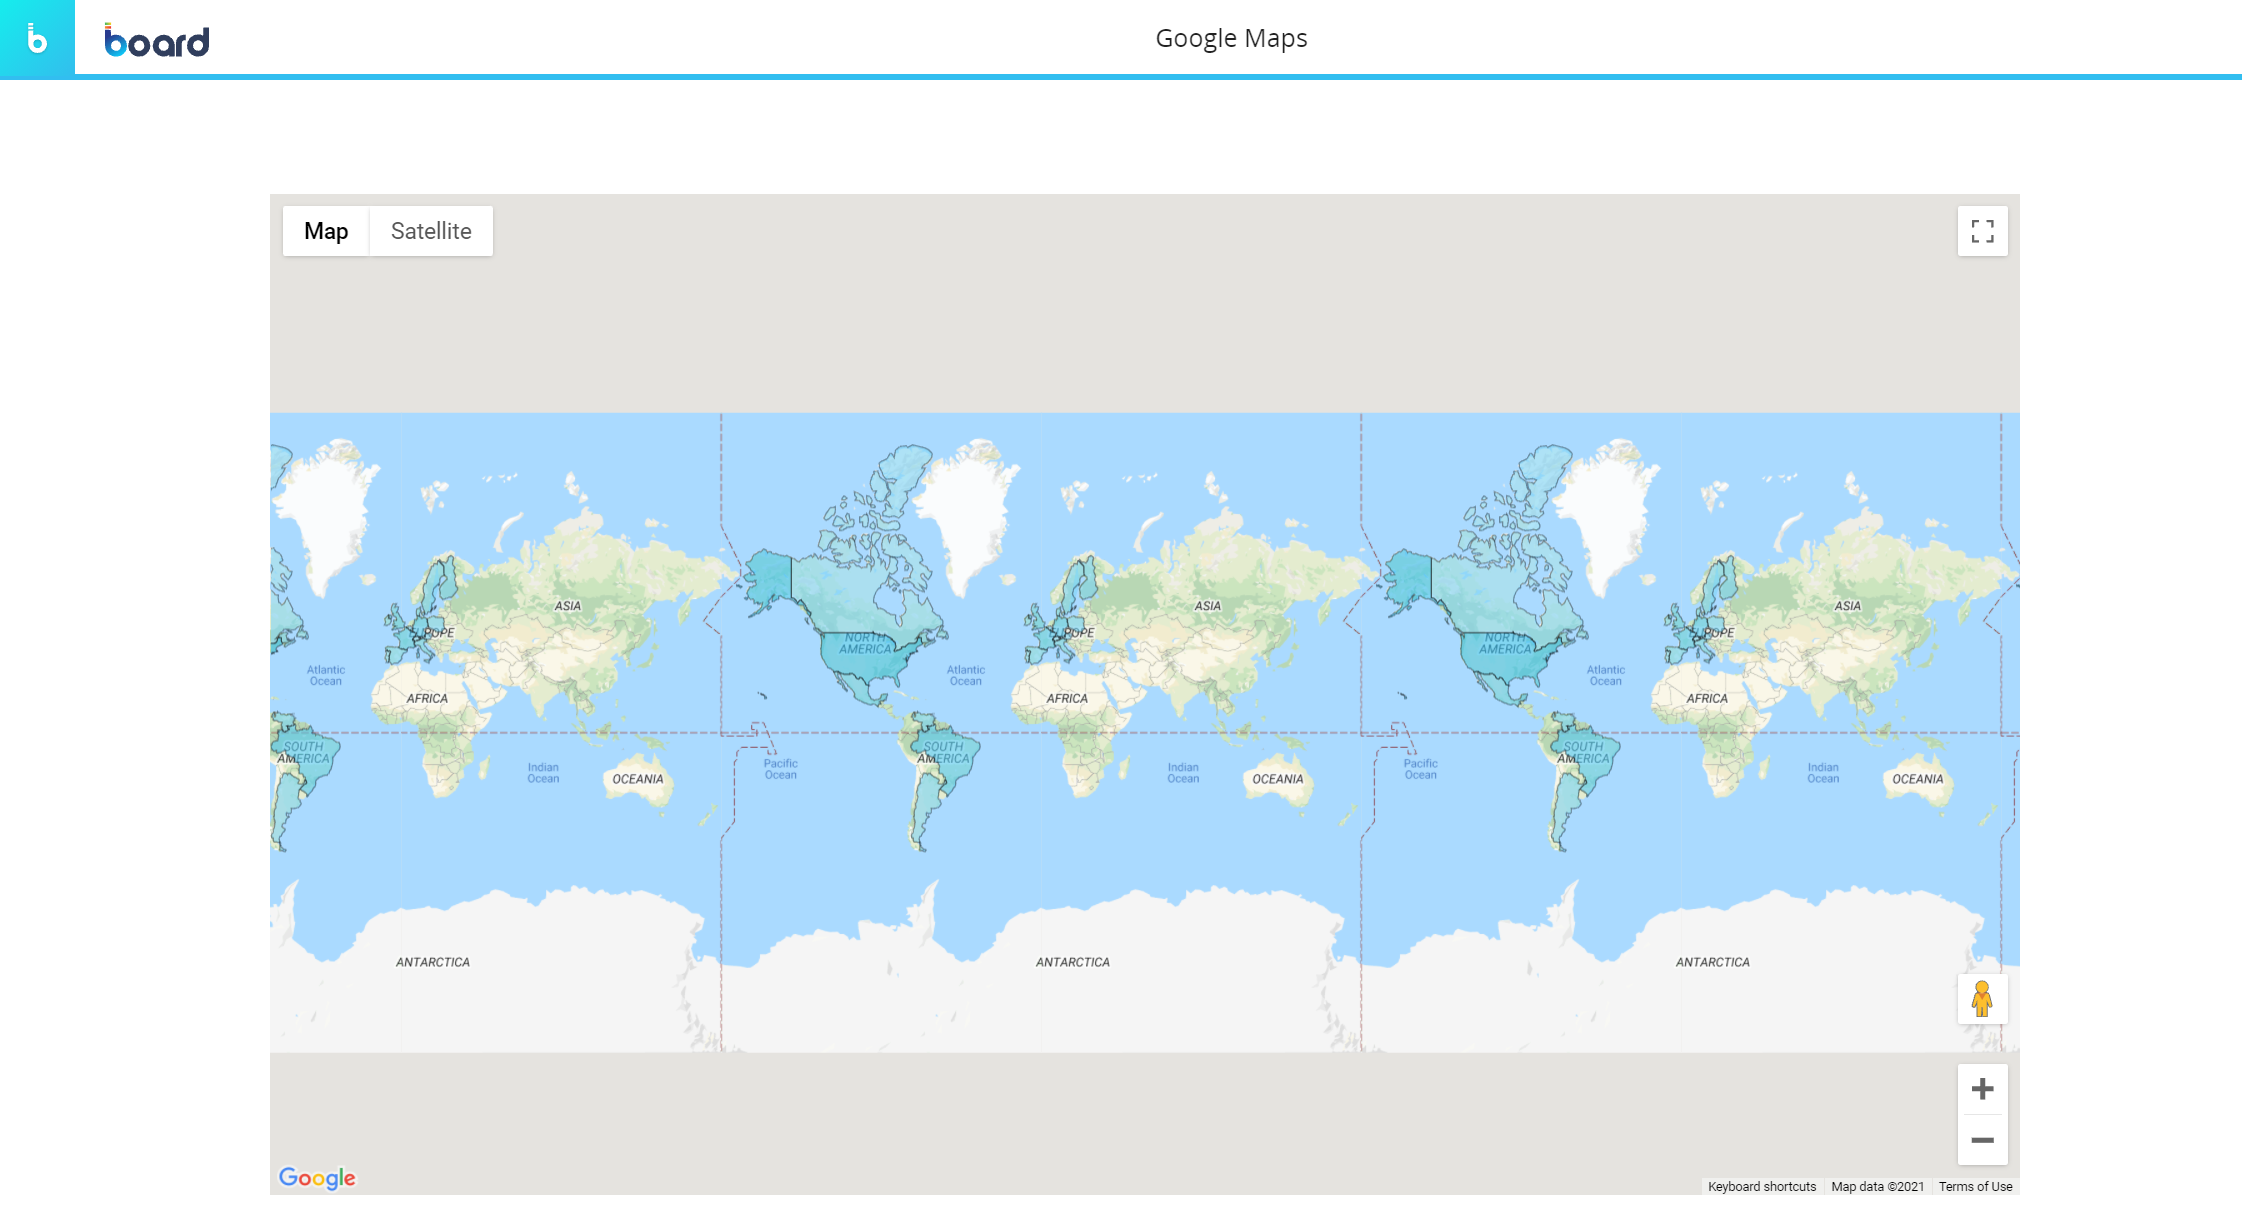
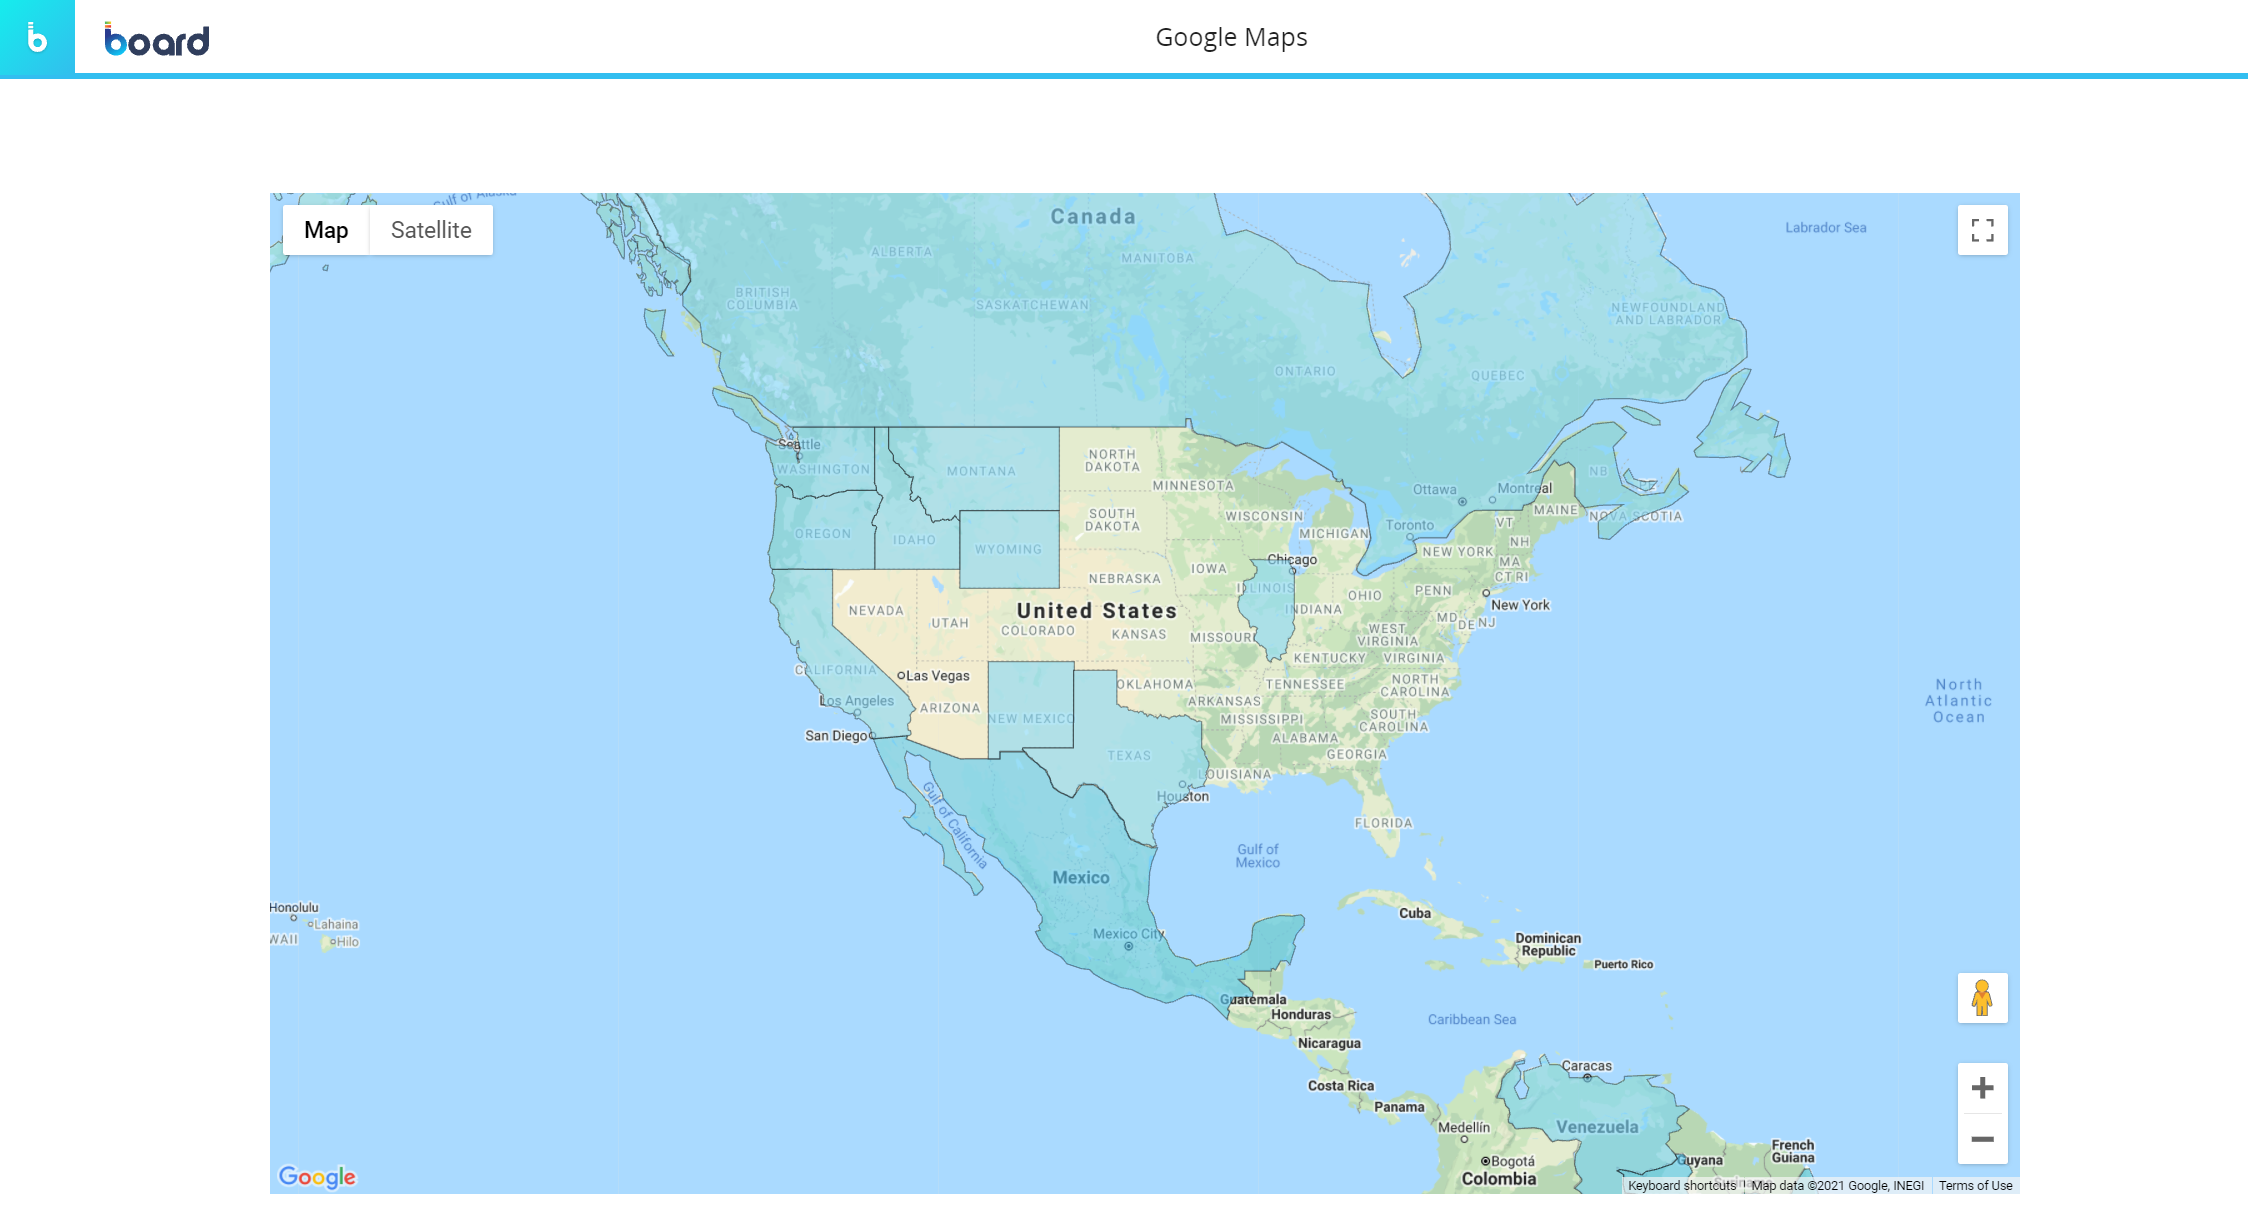
In the example above a JSON map has been associated with the zoom level 0 and another JSON map with zoom level 3: when users will zoom on the map, a JSON map layer will be displayed according to this configuration.
In the following pictures you can see the map behavior at zoom level 0 and at zoom level 3:
Interacting with the Google Maps Object in Design mode
In Design mode, the Google Maps Object provides the same interactive features available in Play mode, with a few notable differences regarding Drill functions.
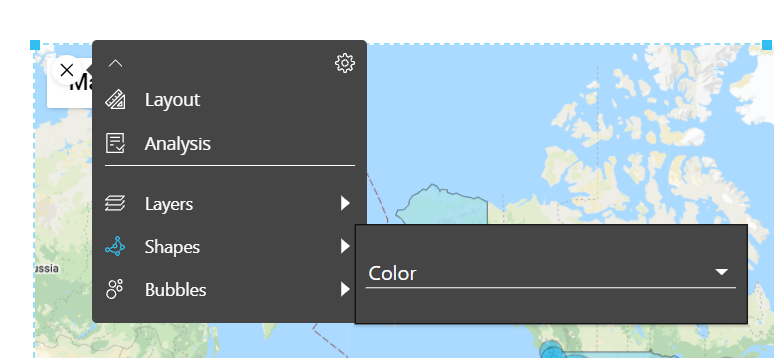
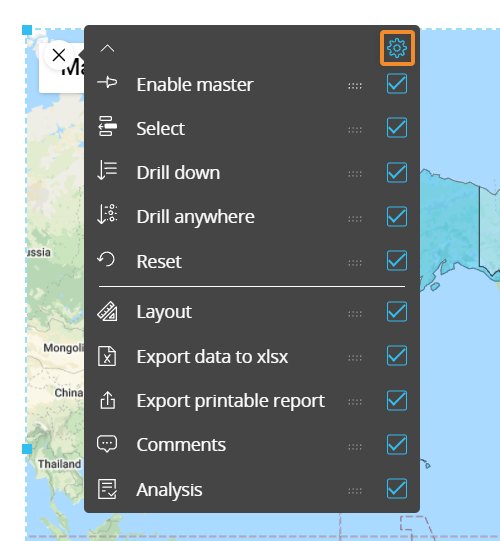
You can also configure which options will be available in the contextual menu (sliding toolbar) in Play mode. To do so, hover over the map and click the contextual menu icon (![]() ) in the top left corner, then expand it by clicking on the downward facing arrow: the configuration panel is accessible from the gear icon in the top right corner.
) in the top left corner, then expand it by clicking on the downward facing arrow: the configuration panel is accessible from the gear icon in the top right corner.
Default drill-down
You can configure a drill down path that will be saved in the map configuration: that will be the default drill that will be performed in Play mode, when end users select a Bubble and click on the Drill down button.
Map areas don't support drill features.
To configure the default drill, proceed as follows:
- Select a Bubble and click the Drill anywhere icon (
 )
) - From the pop up window, select the Entity to drill down on and click OK. The configured drill is performed and data is displayed in a Data View
- Close the drill down window and save the Screen. The configured drill is now the default drill, both in Design and Play mode
End users will still be able to configure other drill down paths in Play mode, if they're allowed to do so. See next paragraph for more details.
Screen selections and selections made by the user using Selector Objects (if any) also apply to data in drill down windows.
Limit Drill down entities
You can limit drill down paths that end users are allowed to configure by selecting the Entities the user can drill down on.
To do so, while in Design mode, check the "Limit drill down entities" checkbox in the drill anywhere configuration window and select the Entities you want to show to the end user. These entities will be the only ones available during the drill anywhere configuration in Play mode.
Drill-to-screen
To allow users to drill-down from the map to another Screen within the same Capsule with a selection on the selected Bubble element, proceed as follows:
- Select a Bubble and click the Drill anywhere icon ()
- From the pop up window, select the Screen tab and choose the destination Screen. Check the "Same tab" checkbox to open the destination Screen in the same browser tab.
The Drill to screen mode, if enabled, will open the destination Screen with a selection on the selected Bubble element when the user selects it and clicks on the Drill-down icon.
The Go to screen mode, if enabled, will open the destination Screen when the user selects a Bubble and clicks on the Drill-down icon. The destination Screen won't inherit any selection from the map. - Click OK to save the Drill-to-screen configuration.
This feature allows you to nest your analysis in a more powerful way than the standard drill-down, which only changes the level of granularity of a report. In a drill-to-screen navigation the data represented (values, indexes) and types of objects (Charts, Dashboards, Data Views) may vary as the user drills from a top level view to another Screen at a more detailed level.
Screen selections and selections made by the user using Selector Objects (if any) also apply to data in the target Screen.
Drill-procedure
It is possible to trigger a procedure from a map when the user selects a Bubble and clicks on the Drill-down icon. The procedure is launched with a selection filter applied based on the clicked Bubble.
If a drill-procedure containing two or more procedures is configured, when the user double-clicks on a Bubble, a pop-up window allows the user to select the procedure to run from a configured list.
To configure a drill-procedure, proceed as follows:
- Select a Bubble and click the Drill anywhere icon ()
- From the pop up window, select the Procedure tab and choose the desired Procedures.
- If the checkbox in the middle is unchecked, the dropdown menu on the left allows to choose from procedures saved at the Capsule level
- If the checkbox in the middle is checked, select a Data model from the dropdown menu on the right. By doing so, only procedures belonging to the chosen Data model will be shown in the dropdown menu.
After you've chosen the desired procedure, click the ADD button on the right. Repeat the process for each procedure you want to add to the drill
- Click OK to save the Drill-procedure configuration.
Screen selections and selections made by the user using Selector Objects (if any) also apply to data in drill down windows.
Drill through
It is possible to execute a Drill through from a map when the user selects a Bubble and clicks on the Drill-down icon. The Drill through is executed with a selection filter applied based on the clicked Bubble.
Drill throughs are configured in the Drill through section of the Data model.
To configure a Drill through on Bubbles, proceed as follows:
- Select a Bubble and click the Drill anywhere icon ()
- From the pop up window, select the Drill through tab and choose the desired Drill through
- Click OK to save the Drill through configuration.
Screen selections and selections made by the user using Selector Objects (if any) also apply to data in drill down windows.
Learn more about: