About Data Block settings
By clicking on a Data Block, you can configure additional settings and properties for it through the Block settings sliding right panel.
The Block settings panel gives you plenty of options to manipulate the data and its appearance in the Screen Object associated with the Layout you're configuring. Some settings are common to all Screen Objects, while others are specific to each individual Screen Object.
For the specific settings of individual Objects, please refer to sections and pages dedicated to each of them in this manual.
Block settings common to all Screen Objects
Some settings may not be applicable to certain Blocks or may not work with specific Screen Objects. In these cases, the "SOLVE ISSUES" button at the bottom right corner of the Layout editor appears as soon as the system detects any configuration error: click on the button to receive further information about incorrect Block settings.
The following Block settings are always available, regardless of the Screen Object associated with the Layout you're configuring:
- Heading
- View
- Color alert
- Data entry
- Time functions
- Analytical functions
- Block references
- Rules
- Detail by
- Total by
- Aggregation
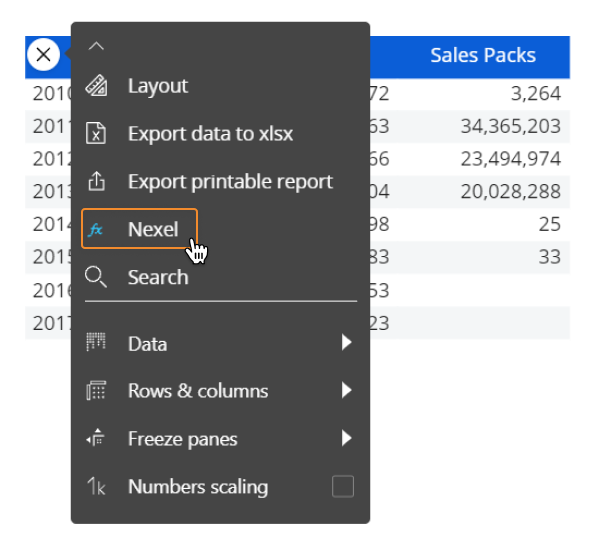
- Nexel
Heading
The Heading field allows you to configure a custom column header name of a Data Block. If omitted, the column header name will reflect the Cube name, The Entity name, the algorithm formula, the Rule name or the Ranking function name as shown in the Data Block list.
Depending on the type of Screen Object, headings may not be displayed.
Depending on the Data type added to the Block list, the Heading menu may offer additional settings: for example, under the heading for an algorithm the actual formula is displayed, along with the algorithm type dropdown menu.
View
The View menu is expanded by default and offers the following settings:
- Digits. Sets the number of decimal digits to display, this option only applies to numeric values
- Summary. Defines the method for calculating row and column totals
On a Block with a Cube the options are:- Total. Totals are calculated by adding the values
- No total: Totals are disabled, so the column and row totals cells are blank
- Average. Returns the average of values in the column
- Maximum value. Returns the maximum value in the column
- Minimum value. Returns the minimum value in the column
- Count. Returns number of entries in the column
- Standard deviation. Returns the standard deviation for the values in the column
If the "Summary" setting for Data Blocks is set to an option other than "Total" and "No total" and the "View totals on expanded groups" property is enabled for a Data View, group totals will be displayed only at the most nested level in the Data View. This is a known limitation.
On a block with an algorithm, a Rule or a Ranking function the options are:
- Total.Totals are calculated by adding the values
- Calculated. The formula is re-applied on rows and columns totals. This option should be selected, for example, for an algorithm that calculates a percentage or any other formula that contains a division.
- Divide by. Divides values by the specified number. This option can be used to display values in thousands or millions.
This option can be applied only to Blocks with a numeric Cube.
- Tooltip by. Displays information based on the content of another Block of the Layout (numbers, text, images, file attachments and more).
The Tooltip by function is particularly useful when used in conjunction with BLOB cubes because it can "link" comments, images, Excel files and more generally any file attachment to any cell of a report (except headers).The Tooltip option can reference any Block of the Layout, including BLOB Cubes. In this case, data entry can also be enabled on the referenced BLOB Cube.
- Hide block. When enabled, it hides the corresponding Block
- Row totals. Enables or disables the calculation of row totals. This option applies only when the Layout has at least one Entity set by column
- Hide zeroes. When enabled, cells that contain a zero value (0) are displayed as blank.
Color alert
The Color alert settings allow to configure conditional formatting (alerts) on a Data Block. The formatting options will change the appearance of values in the selected Screen Object, based on the alert configuration.
The alert is defined by threshold values: the configuration settings show 3 color ranges by default (red, white and green), but you can add as many ranges as you need. Colors can also be customized at will.
In the default configuration, cells of a Block containing values less than the red alert threshold are colored red, while those with a value higher than the green alert threshold are colored green. Cells of a Block containing values greater than the red alert threshold and less than the green alert threshold are colored white.
The alert can be set on manually entered thresholds values or based on values of another Data Block in the Layout. In order for the Color alert option to work, it must refer to numeric data (Cubes, algorithms, Ranking functions, Rules).
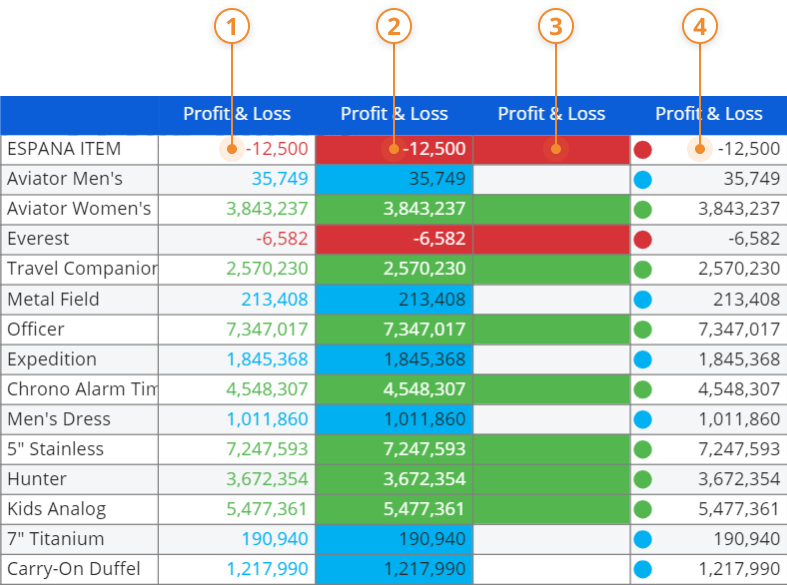
You can choose between the following four alert formats:
- Figures (default). Conditional formatting is applied to the font color
- Blocks. Conditional formatting is applied to the cells background
- Blocks only. Conditional formatting is applied to the cells background and values are hidden
- Smarties. Conditional formatting is applied to a small circle that appears to the left of values, in their very cells.
Data entry
The Data entry option allows data entry on the selected Data Block. By default, cells that accept data entry actions are displayed with an ivory background.
Data entry can be enabled on blocks populated with:
- A Cube. In this case, a data entry action saves a value (numerical, text, a date) or a file in the specified Cube
Data entry actions on BLOB cubes must be performed at physical level, i.e. the cube dimensions must be present in the "BY ROW" or "BY COLUMN" fields in the axis area.
- An Algorithm. In this case, a data entry action saves a value to a Cube by reversing the formula of the calculated Block (see the "Reverse algorithm" paragraph below)
- An Entity. In this case, a data entry action allows to assign or change a hierarchical relationship
Activating this option alone is not sufficient to enable data entry. The following additional conditions must be met:
- The user must have an appropriate Board license and the necessary security privileges to perform write-back actions
- For text, date, and BLOB Cubes data entry is supported only at physical level, not on aggregate views
- Time functions (such as Previous Year, Yearly Cumulated Valued, etc.) and reference functions (such as Refer to, Detail by, etc.) cannot be activated if the data entry option is enabled
- If the Layout view is an aggregate view on the data entry Cube, the Data Split&Splat (logical data-entry) feature must be enabled
In conjunction with the data entry, it is possible to enable the following options on the same Data Block:
- Split splat (enabled by default): enables or disabled the Data Split&Splat (logical data-entry) feature
- Reverse algorithm: allows to enter a value on a calculated Block (algorithm) in order to recalculate one of the factors of the formula and write it on the corresponding Block.
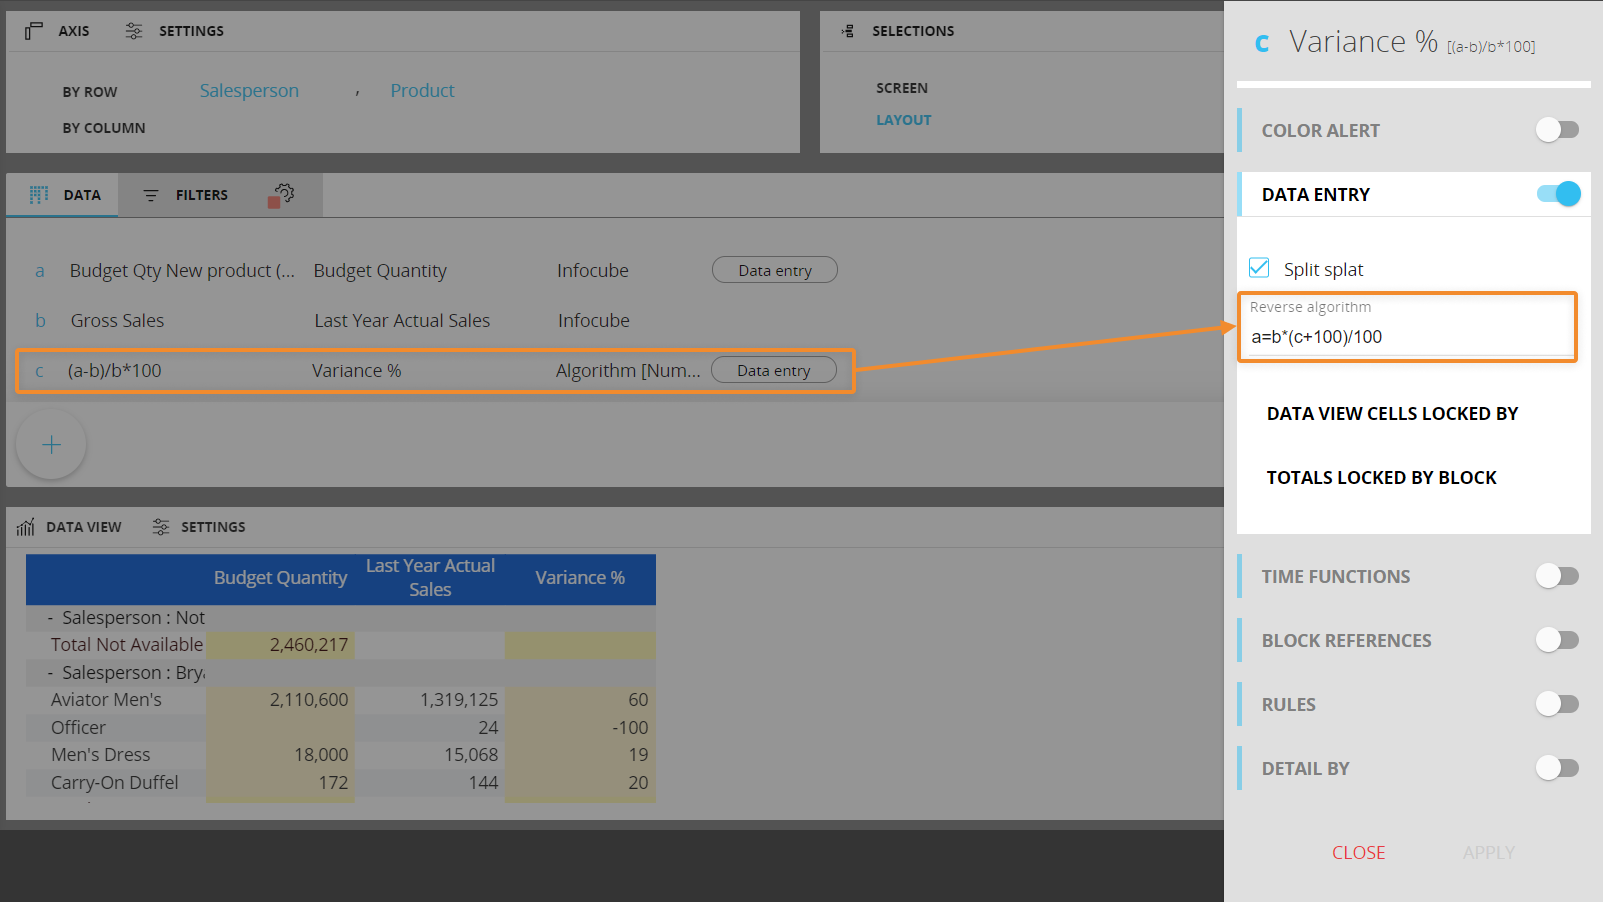
Example
Consider the following report:

The Data Block "a" contains the Budget Quantity Cube and the data entry option is enabled, so the user can enter a budget value on this Block.
The Data Block "b", Last Year Actual Sales, contains the sales value of last year: it is a reference value that helps the user to define the budget.
The Data Block "c" is the variance percentage obtained with an algorithm whose formula is: c=(a-b)/b*100. The Data entry option is enabled on this Data Block, so the user can enter a desired variance percentage and Board is able to derive the Budget Quantity corresponding to the given variance.
The Budget quantity value is derived by applying the following reverse formula in the "Reverse algorithm" field: a=b*(c+100)/100.
In the reverse algorithm field, type the necessary elements in the following order:
-
The Data Block that represents the variable to change when the user enters a value (Block "a" in the example above)
-
The equal sign
-
The formula itself (a=b*(c+100)/100 in the example above)
The target Data Block of the reverse algorithm must be a Cube with the data entry option enabled.
-
- Validation rules: allows to define a validation formula in order to automatically accept or reject entered values.
This allows, for example, to accept the input value only if it is positive (in case of a budget price), or only if it is lesser or greater than a given value or a value of another Data Block.
A validation rule is a logical expression, which checks whether the condition for the entered value is TRUE or FALSE: if the expression returns TRUE then the rule is met and the entered value is accepted; if the expression returns FALSE the entered value is not accepted and a an error icon with a custom message is displayed.
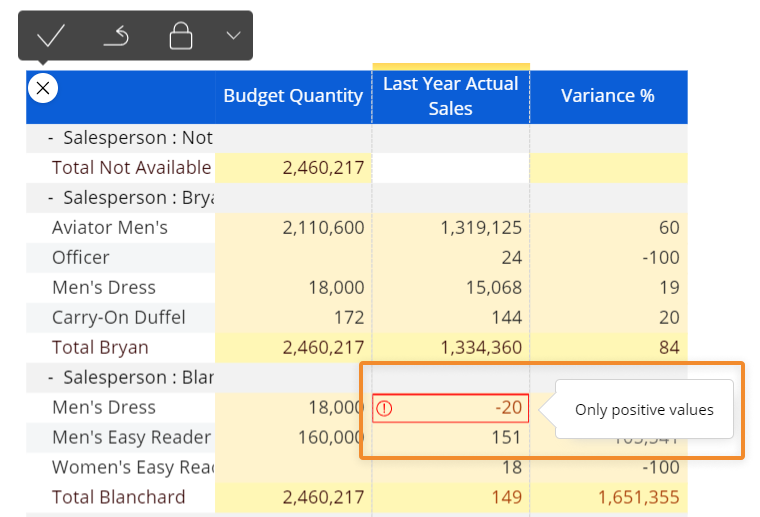
Validation rules are defined under the "Data entry" menu: click "Input validation rules", then click "Add new rule" and type the logical expression and the corresponding error message to display when the rule is not met.
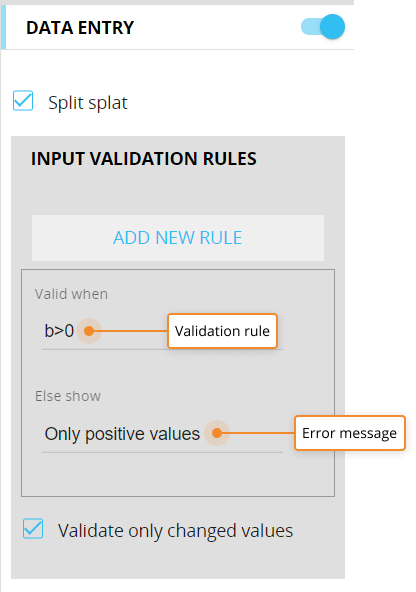
Logical expressions use the same syntax as algorithms.
The "Validate only changed values" option applies the validation rule only to cells that have been modified. This is particularly useful when adding a validation rule to an existing Layout that results in values that don't meet the new rule, but still need to be displayed (for example, historical data). - Suggested values. Allows to configure suggested values that will be shown to the user during data entry actions (i.e. double-clicking on the cell to be modified). These values are taken from another Block or Entity in the Layout, or from a manually configured Custom List.
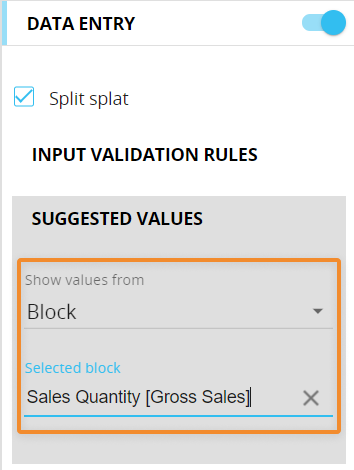
Example
On Block "a", "Budget Quantity", the data-entry and the suggested values options have been enabled. Block "b", "Sales Quantity", contains the values to be suggested to the user.
Here's the configuration in the Layout editor:
The result of this configuration in a Data View is the following:
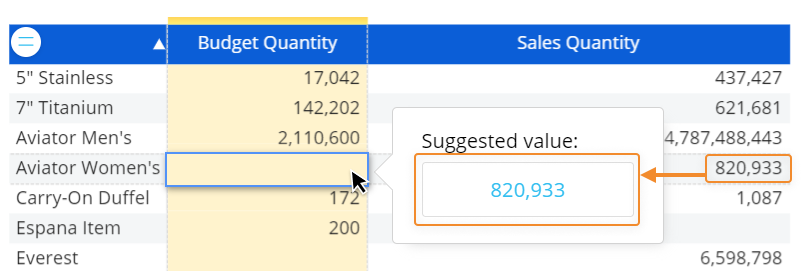
In case of suggested values taken from an Entity or a Custom list, the user will be presented with multiple suggested values for a single data entry action. The list supports vertical scrolling and its elements are filtered as the user writes in the cell.
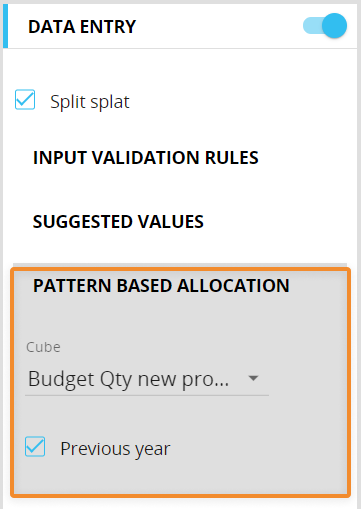
The list displays a maximum of 200 items: if the desired item is not displayed in the list, start typing in the cell to search on the entire set of suggested values. - Pattern based allocation. The logical data-entry, also called Data Split&Splat, is a feature that allows you to enter numeric data at any aggregation level and automatically have Board allocate it down to the underlying cells of the Cube.
With the Pattern based allocation option turned on, when a total value is entered by the user on the selected Cube, the Data Split&Splat feature automatically allocates it down to detail cells contributing to that total based on a pattern obtained from a Cube other than the one where data entry actions are performed.
The allocation happens across any dimension of the Cube, such as product, customers, territories and time, down to the most detailed level in the hierarchy.The Cube with data entry enabled and the Cube providing the data entry Pattern must share the same structure. This feature allows you to allocate data using patterns (drivers) other than proportional ones.
When a pattern based allocation is active, the user will be prompted to use it at each data entry action performed on the configured Cubes. If the user chooses not to use it, a traditional Split&Splat allocation will be performed.
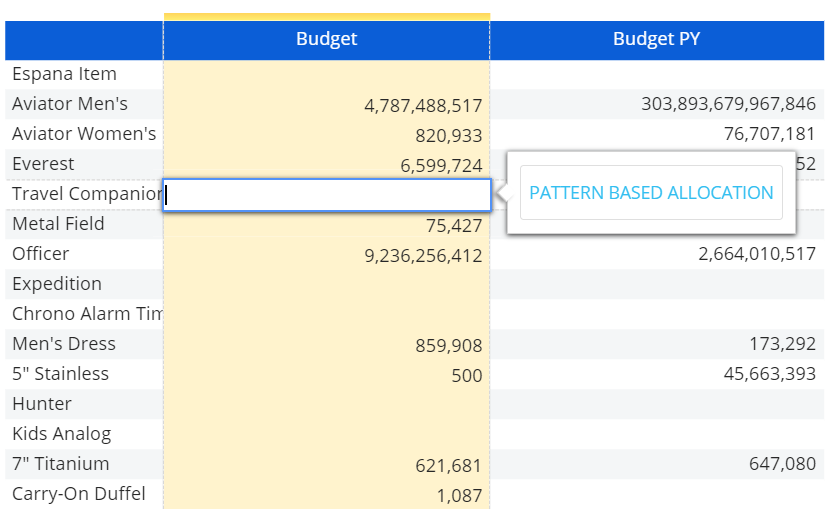
Here's the configuration in the Layout editor:
The pattern based allocation allows inserting data at an aggregate level, even on empty cells. To verify the allocation, drill-down to a less aggregate dimension on a cell where you performed a data entry action and review how the value you entered has been split between underlying cells.
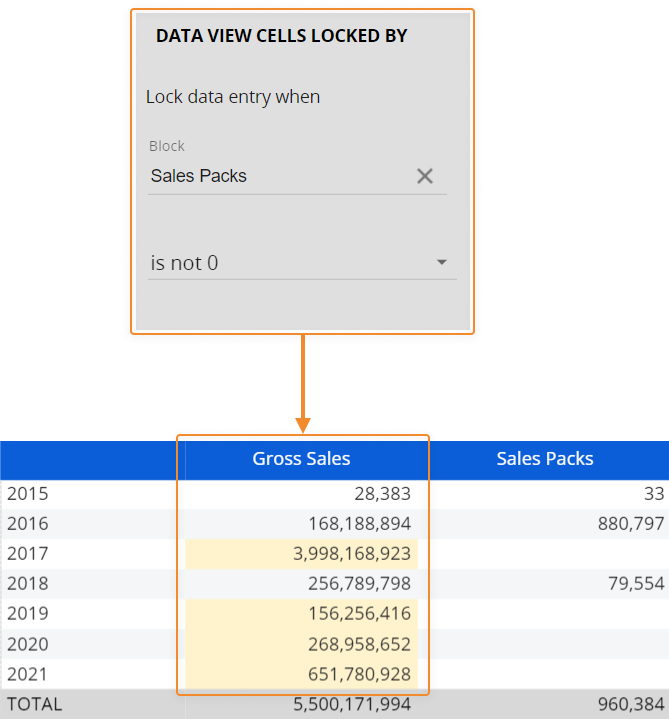
Pattern based allocation is also available as a procedure step named "Save Data Entry using a pattern based allocation", under the "Data entry" actions group. - Data View cells locked by. In a Data View, this option allows locking or unlocking data entry on cells based on values from another Block. Locked cells are shown with a different background color.
The locking rule works at the data aggregation level displayed in the Data View, so it considers only cells that are visible on the Screen. If you drill down to a different aggregation level, the locking rule will only consider cells displayed in the drill-down window.If the value of the locking Block is equal to zero (or is not equal to zero, depending on your configuration) then data entry actions are allowed on the current Block. For any other value of the locking Block, data entry actions are disabled even if the Data entry option is active.
For example, consider the following Data View where a Data View cells locked by rule has been configured on the Gross Sales Block:
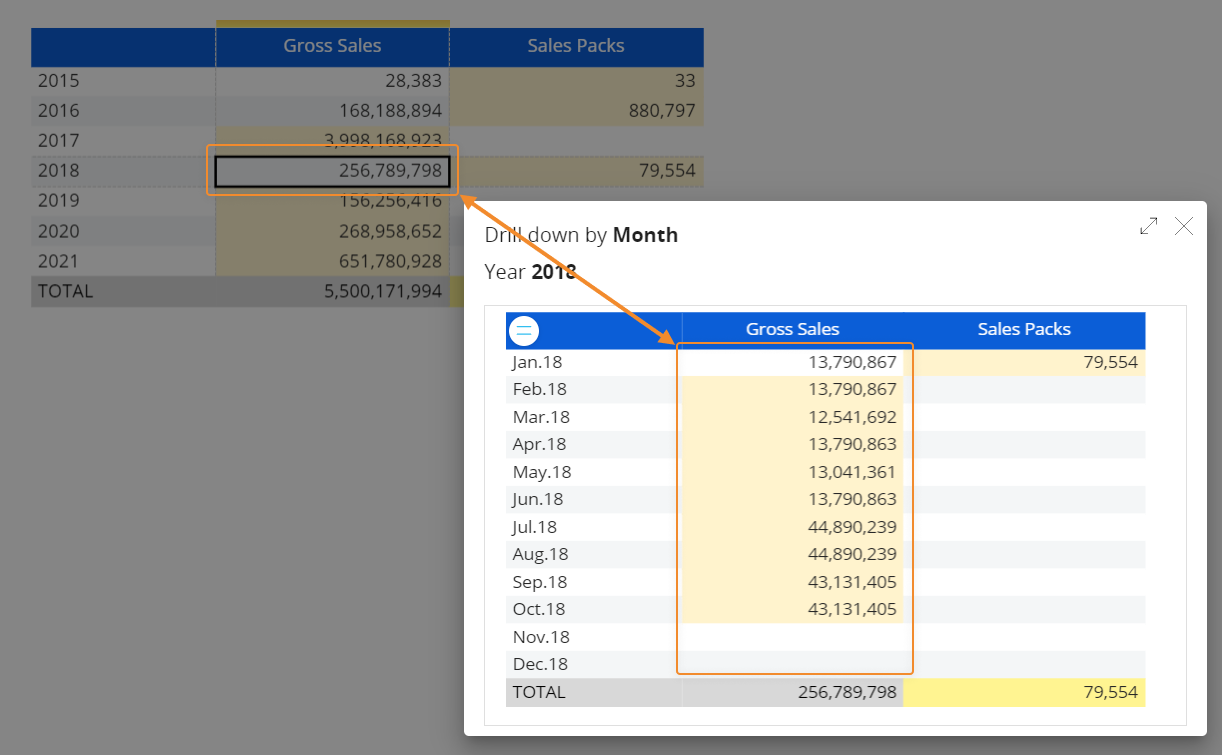
If you drill down by Month on the cell corresponding to the year 2018, which is locked in the Data View, you will still be able to enter data on the Cube, since the locking rule considers only cells displayed in the drill-down window (i.e. cells at that current level of aggregation).
- Totals locked by Block. Applies the conditional locking either on Row totals or on Column totals of a single Block. When enabled, with every data entry action this option causes a proportional reallocation on the detail cells whose sum is the fixed (locked) total.
When a total is locked, a small lock icon appears in the cell:
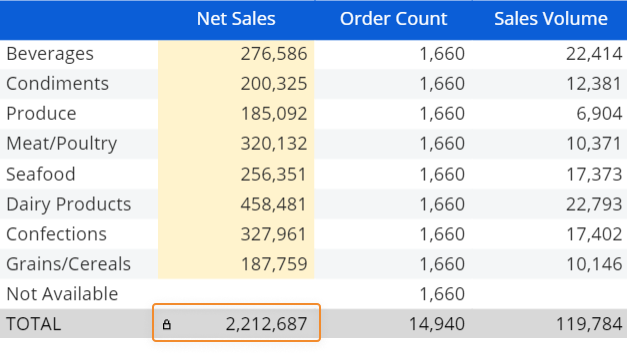
If the value of the locking Block is equal to zero (or is not equal to zero, depending on your configuration) then data entry actions are allowed on the currently selected Block in Row totals cells or in Column totals cells. For any other value of the locking Block, data entry actions are disabled in in Row totals cells or in Column totals cells, even if the Data entry option is active.
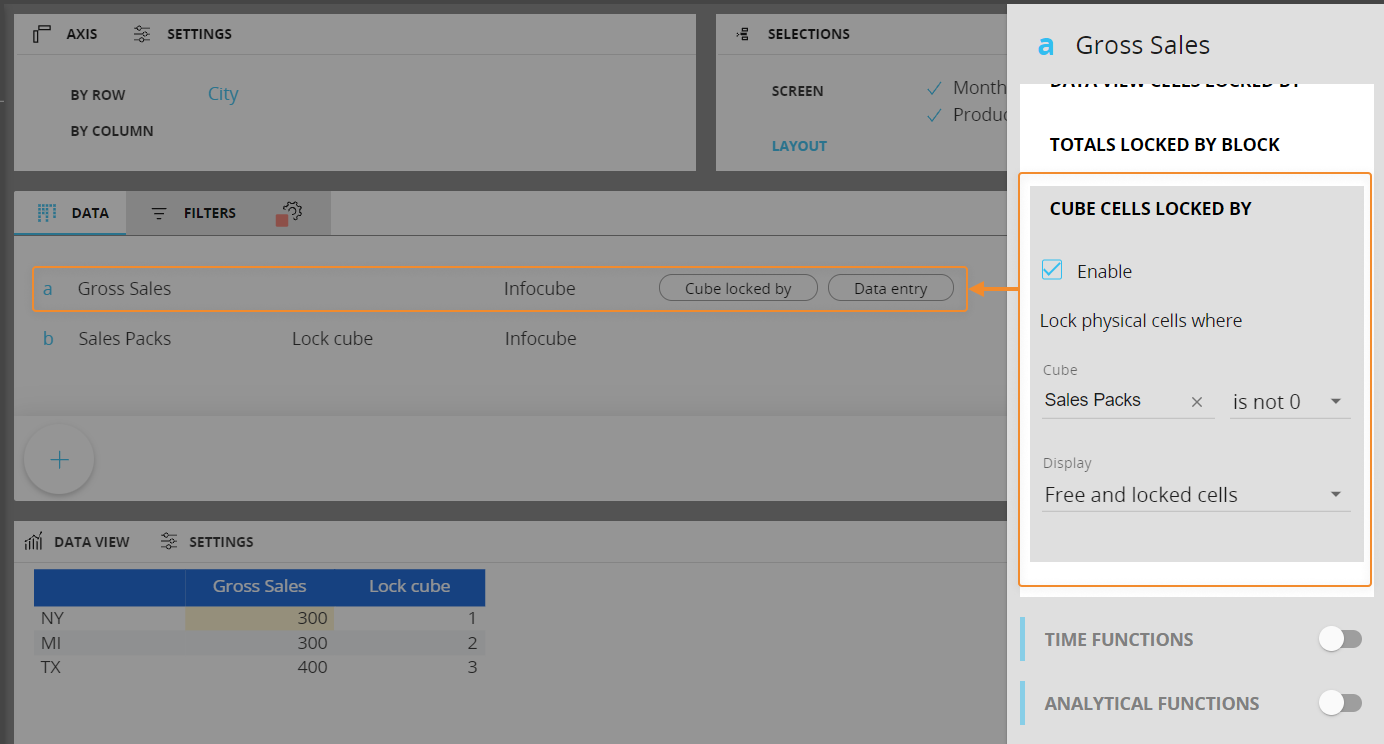
- Cube cells locked by. This option allows to lock or unlock data entry on physical cells of a specific Cube based on values from another Cube and to show or hide locked cells. Locked cells are shown with a different background color.
The Cube cells locked by rule works at the Cube level, across any level of aggregation, regardless of the cells actually displayed in the Data View: you will always be able to perform data entry actions if at least one underlying cell allows the allocation (and the value in it is not 0).
The Display dropdown menu allows you to show only values of free (editable) cells or values of both free and locked cells: if you select the "Free cells only" option, aggregated views will only consider cells that are not locked at the physical level of the Cube.If the value of the locking Cube is equal to zero (or is not equal to zero, depending on your configuration) then data entry actions are allowed on the current Cube. For any other value of the locking Cube, data entry actions are disabled even if the Data entry option is active.
For example, consider the following Layout where a Cube cells locked by rule has been configured on the Gross Sales Block:
The "Cube cells locked by" option is ignored if a Reverse Rule is defined to write data to a locked cell, since Reverse Rules are always allowed to write to any cell of the Cube.
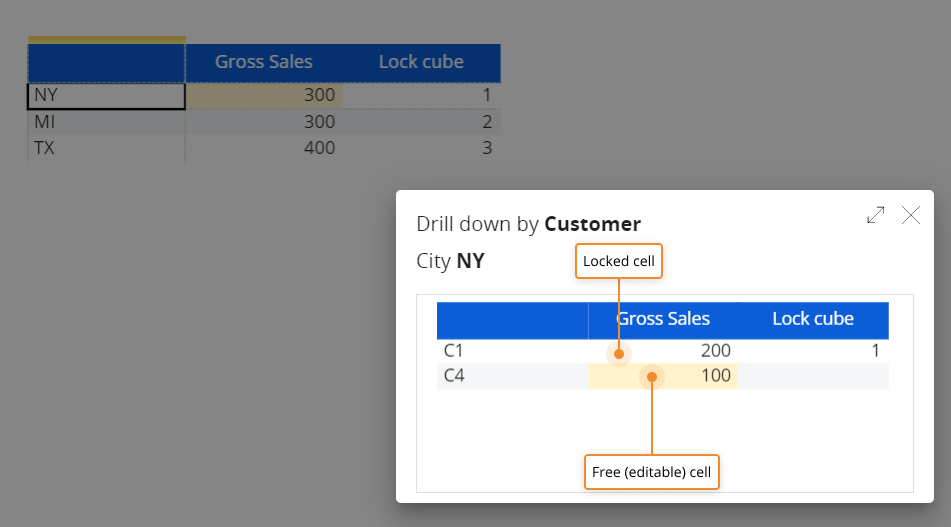
 If you drill down by Customer on the first row of the resulting Data View, you will notice that one underlying cell is locked as per the locking rule and the other one is free (editable):
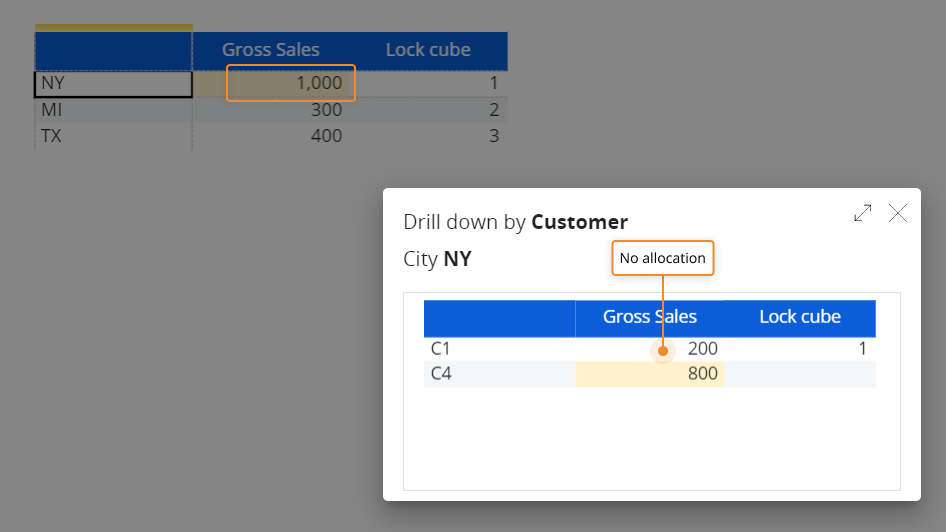
If you change the Gross Sales value for NY in the Data View and drill-down again, only the free cell will display a different value: the locking rule has prevented the Split&Splat feature from allocating new values in the underlying locked cell of the Cube.
Time functions
Time functions allow to quickly create analyses comparing year-on year data, obtain year-to-date data, forecast data, rolling totals and more. Time functions are commonly applied to Data Blocks containing numerical Cubes.
Time functions cannot be applied to Cubes with only one dimension or Cubes structured by a custom time Entity.
The available time functions are the following:
- Previous Year. When the checkbox is ticked and no other function or option is active, it returns the previous year's data for the currently selected periods. For example, if the current Screen selection is May 2021 to July 2021, the previous year function will return data for May 2020 to July 2020
- In the "Function" dropdown menu:
- Value (default). Doesn’t apply any function
- Previous Period Value. Returns the data of the previous period, based on the currently selected period. For example, if the current selection is July 2021 and August 2021 on the Month Entity, it returns data for June 2021 and July 2021. If the current selection on the Week Entity is on week 15, the function returns data for week 14
- Previous Year Value. Works exactly like the "Previous Year" checkbox mentioned at the beginning of the list: it returns the previous year's data for the currently selected periods
- Yearly Cumulated Value. Returns the cumulated value from the beginning of the current year. For example, when the function is applied to a Cube dimensioned by Month, it returns the cumulated value from January of the currently selected year. When it's applied to a Cube dimensioned by Day it returns the cumulated value from the first day of the currently selected year.
The Yearly Cumulated Value function can be combined with the "Fiscal Year" option (checkbox) to obtain the cumulated value from the first period of the currently selected fiscal year. This option is available only if the fiscal year has been configured in the "Time range" section of the Board Data model in use.
You can use the "Cycle" field to set different rolling periods for the cumulated value calculation. For example, setting the Cycle to "2" on A Cube dimensioned by Month will result in he cumulated value from January to the current month of two years before the currently selected year.
The calculation of Cumulated time functions is driven by the time dimensions added in the Axis area of the Layout Editor and and not by the time dimension in the Cube structure (i.e. It is possible to apply a Cumulated time function, such as the Yearly Cumulated Value, on a Cube dimensioned by Week in a Layout by Month).
To use the Yearly Cumulated Value function, you're not required to create specific Cube versions dimensioned by the same time Entities in the Axis area of the Layout. - Yearly Moving Total. Returns the cumulated value over the course of the previous 12 months up to the currently selected period. This is a rolling yearly sum, so changes at the end of each month with data from the new month added to the total and data from the first month of the period taken away. For example, if the current selection is July 2021 on the Month Entity, the function returns the cumulated value from August 2020 to July 2021.
You can use the "Cycle" field to set different rolling periods. The Cycle value defines the number of periods to be considered for the calculation. For example, setting the Cycle to "3" on A Cube dimensioned by Month will result in a rolling total over three months, while setting the Cycle to "6" will result in a rolling total over six months. Setting the cycle to 90 on a Cube dimensioned by Day will result in a rolling total over the past ninety days.
- Yearly Moving Average. Returns the average period value over the course of the previous 12 months up to the currently selected period. For example, when applied to a Cube dimensioned by Month, this function returns the Yearly Moving Total value divided by 12.
You can use the "Cycle" field to set different rolling periods for the average value calculation. For example, setting the Cycle to "3" on A Cube dimensioned by Month will result in a rolling total over three months divided by three, while setting the Cycle to "6" will result in a rolling total over six months divided by six.
- Last Value. Replicates the last non-zero value found in the time series into subsequent zero-valued cells until a new non-zero value is encountered, then the function replicates the new value into subsequent zero-valued cells. For example, if the current selection runs from July 2020 to July 2021 in a Layout by Month and there's data up to December 2020, the function replicates the December 2020 value to January 2021, February 2021, March 2021, April 2021, May 2021, June 2021, and July 2021.
- Trend. Applies a linear function to the Cube and calculates predictive values of future periods (the prediction is represented with a straight line when plotted on a chart). The statistical model used to calculate the Trend function is based on a Moving Average model.
It is recommended to apply the Trend function to Cubes with at least one year of historical data.
The Trend function can be combined with the "Ignore Current Period" option (checkbox) to exclude the last period of the current time selection from the data set used to calculate the statistical functions. - Forecast. Applies a statistical forecasting function to the Cube and calculates predictive values of future periods. This function estimates the trend component and the seasonal component based on the historical data of the Cube to return a forecast that includes historical trends and seasonality.
Depending on the historical data series available, Board automatically selects the most appropriate statistical model from three options based on the exponential smoothing and moving average models, ARIMA models and the Winters models.The Forecast function can be combined with the "Ignore Current Period" option (checkbox) to exclude the last period of the current time selection from the data set used to calculate the statistical functions.Ignore Current Period. This option can be enabled when the Trend or Forecast statistical functions are used. It excludes from the data set used to calculate the statistical functions the last period of the current time selection.
- Period Offset. The time selection is shifted by the specified number of periods. For example, by setting Period offset to "-3" the function is applied to a time selection three periods before the currently selected one: depending on the Cube structure, it can be three months, three weeks or three days. If you apply a Period offset of "-12" to a Cube dimensioned by Month, you'll get a result equivalent to the previous Year function.
The "Period offset" option cannot be used in conjunction with the "Previous year" option.
-
Cycle. Defines the time period for the following cumulative functions:
-
Yearly Cumulated Value
-
Yearly Moving Total
-
Yearly Moving Average
-
Analytical functions
Under the "Analytical functions" menu you can apply any function to a Cube in order to get useful common mathematical results on the fly.
These functions can are grouped into three different categories:
- Analytical Functions
- Time Series
- Statistical Functions
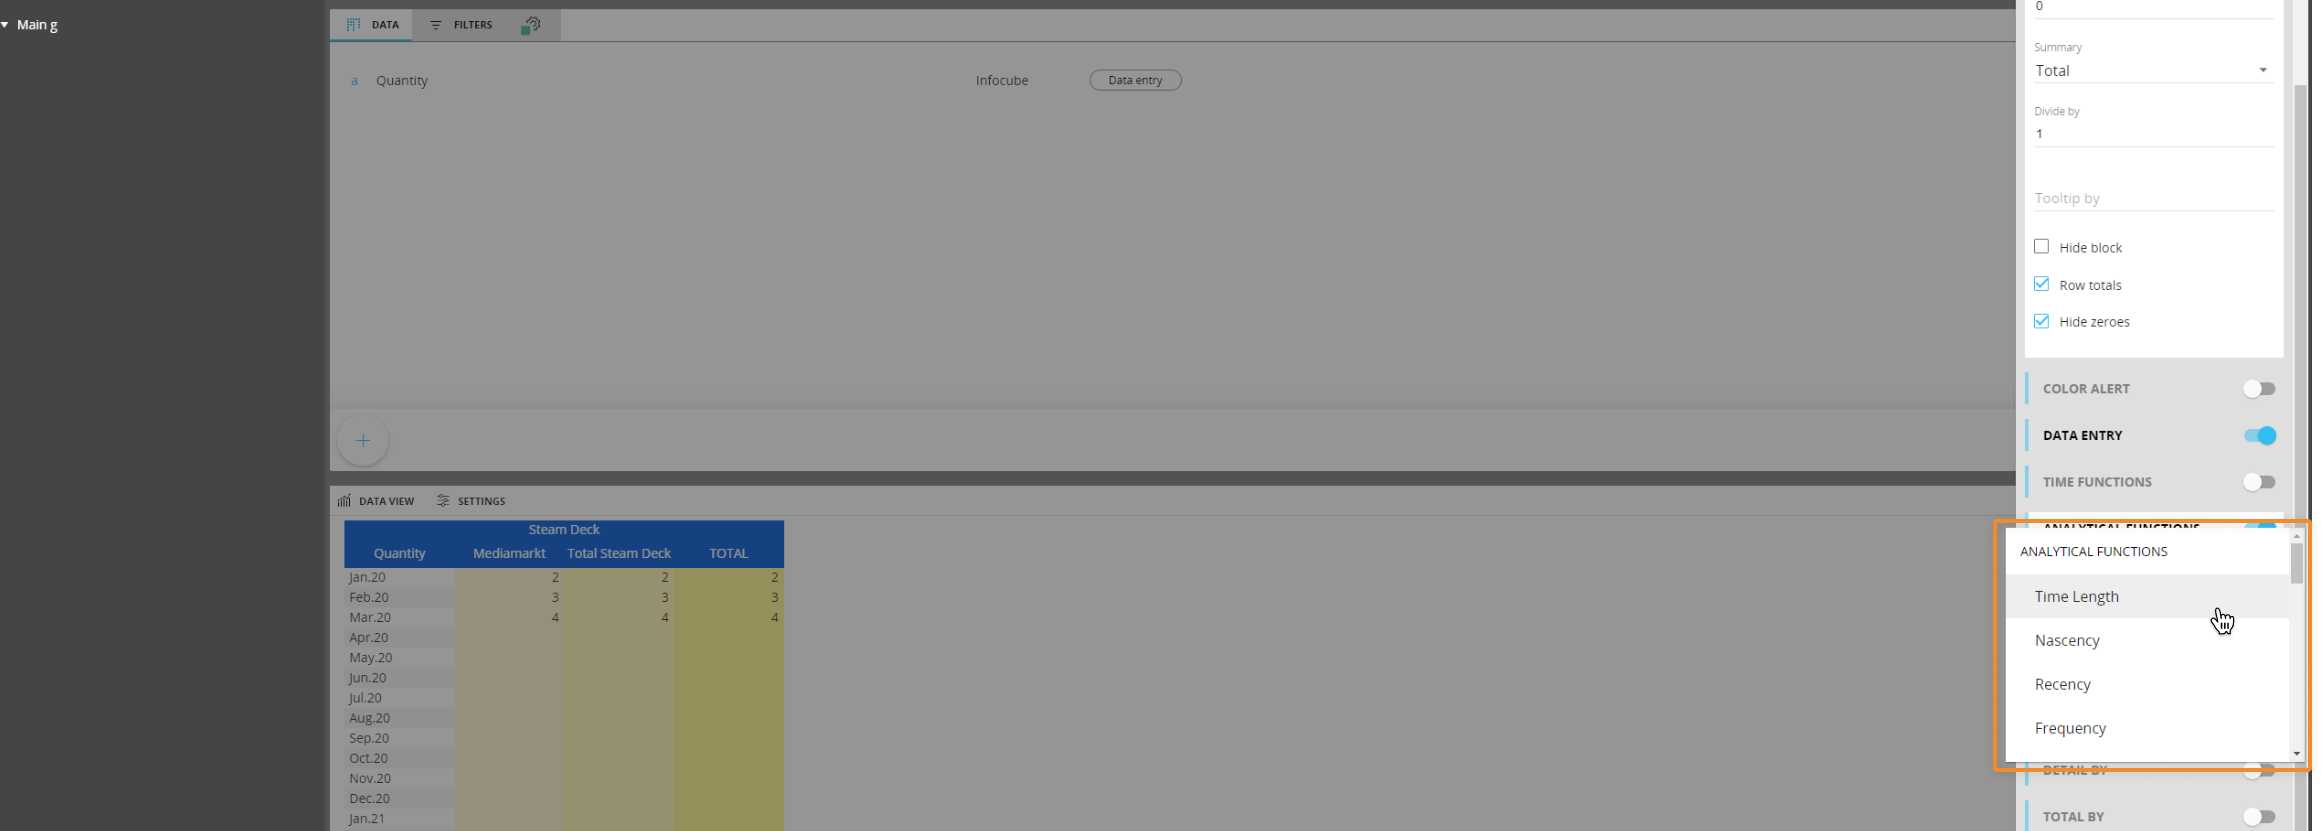
Analytical functions work across Time Entities only. This means, for example, that if you use the Maximum function in a Data View, it will return the value of the period with the maximum amount, You cannot use this function to determine the maximum across various products.
The Time functions under the Time Series group will return a series of values as output, so they must be used in a Layout with at least one time entity By row/column. The other functions return a single value, so they do not need a Time Entity in the axes. If you use them with any Time Entity, the function will calculate values “until the period in row/column”.
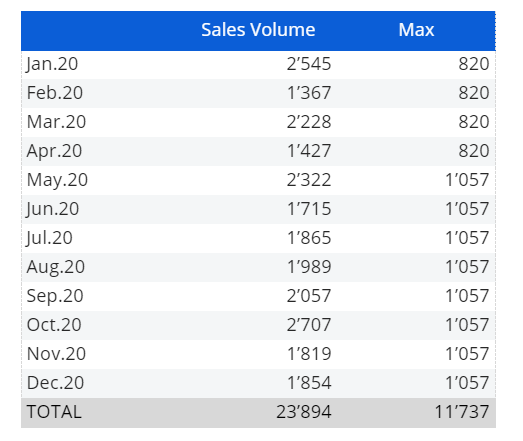
On every row we have the maximum value of the series until that moment, removing the Entity "Month" from the axis you would just get the overall maximum.
When using those functions in Dataflows, the row logic is ignored and you will always get the overall maximum.
The analytical functions available in this menu are the following:
- Analytical Functions
- Time Length: it returns the amount of periods on which the time series is defined.
- Nascency: it returns the amount of periods passed since the first non-zero value of the series;
- Recency: it returns the amount of periods passed since the last non-zero value of the series;
- Frequency: it returns the amount of non-zero valued periods in the series;
- Dormancy: it returns the amount of zero valued periods in the series;
- First Value: it returns the first value of the series;
- Last Value: It returns the last value of the series;
- Min Value: it returns the minimum value of the series;
- Min Not Zero Value: it returns the minimum value of the series which is different from 0;
- Max Value: It returns the maximum value of the series;
- Total: it returns the Total value of the series;
- Average: it returns the average value of the series (Total/Time Length);
- Average Not Zero Values: it returns the average of the values that are different from 0 (Total/Frequency);
- Time Series Functions
- IdsiARX Forecast: given the values in the time series, it returns the forecast according to the IdsiARX algorithm (see the Predictive Analytics section for more details)
- IdsiARX Naive: given the value of the time series it returns the Naive predictor (previous year) for that series.
- Holt Winters: it returns the forecast on future values according to triple exponential smoothing model, the three parameters (alpha, beta, gamma) are configurable.
- Linear Regression: it returns the values of the straight line that best fits the time series in terms of minimum squared error;
- Multiple Linear Regression: same as linear regression but with multiple independent variables.
- Statistical Functions
- Next Value [IdsiARX Naive]: it returns the next value (first forecasted value) of the series according to the naive predictor (Previous year);
- Next Value [Linear Regression]: it returns the next value (first forecasted value) of the series according to linear regression model;
- Growth %: it returns the growth of the time series in percentage (this period value - previous period value)*100/ (previous period value);
- Standard deviation: it returns the standard deviation of the series (squared root of the variance)
- Volatility: returns the standard deviation of the return series;
- R Squared: it returns the r squared of the series defined as the ratio between the squared error of the regression model (residual variance) divided by the squared error of the average (total deviance)
For every function, that you can pick from the "Function" dropdown menu, you will have the following settings:
- Time Entity: This dropdown menu allows you to decide at which level your period is defined. If I am using the Max Value function, for example, and I choose Day as Time Entity, the function will return the amount of the day that contained the maximum value. Otherwise, if I select Month as Time Entity, it will return the value of the best month. With the "Auto" setting, the system will use the Time Entity in the Cube Structure or, if you have a Time Entity set in one of the axes, it will take it from those fields
- From-To: These two dropdown menus allow you to consider only a part of the time series, deciding which periods the function will consider to calculate the output
- The "ignore last period" checkbox is only used for the functions IdsiARX.Forecast, Linear Regression and Multiple Linear Regression, and allows you to ignore the last period in your forecast.
For more details on the statistical functions and predictive analytics, please read the B.E.A.M. section of this manual
Block references
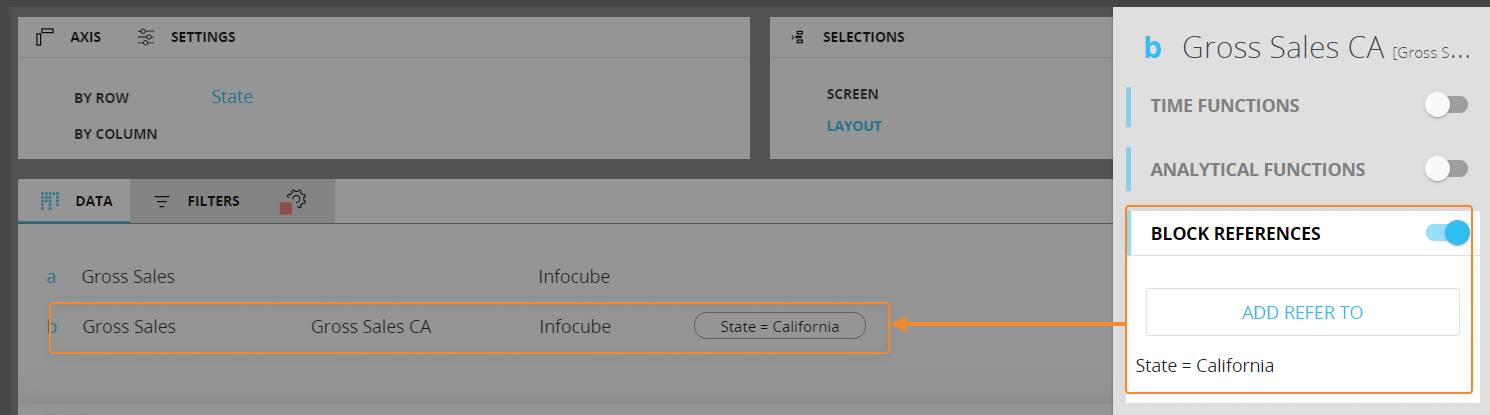
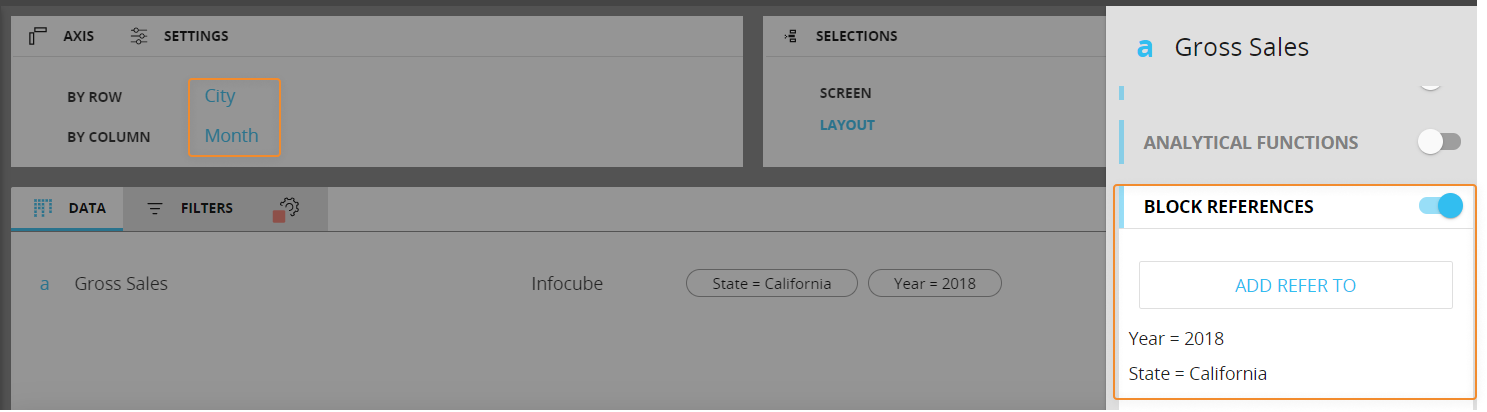
Under the "Block references" menu it is possible to apply the "Refer to" function to a Data Block with a Cube, in order to alter its aggregation or detail level.
The "Refer to" function allows referring the Data Block to a specific Entity occurrence, overriding the Screen selection (Select) and the axes settings.
To do so, click on the "ADD REFER TO" button, select an Entity from the pop up window then select the desired Entity member.
If the "Refer to" function is enabled, any existing security selection applied on the Entity chosen in the "Refer to" function configuration will be ignored.
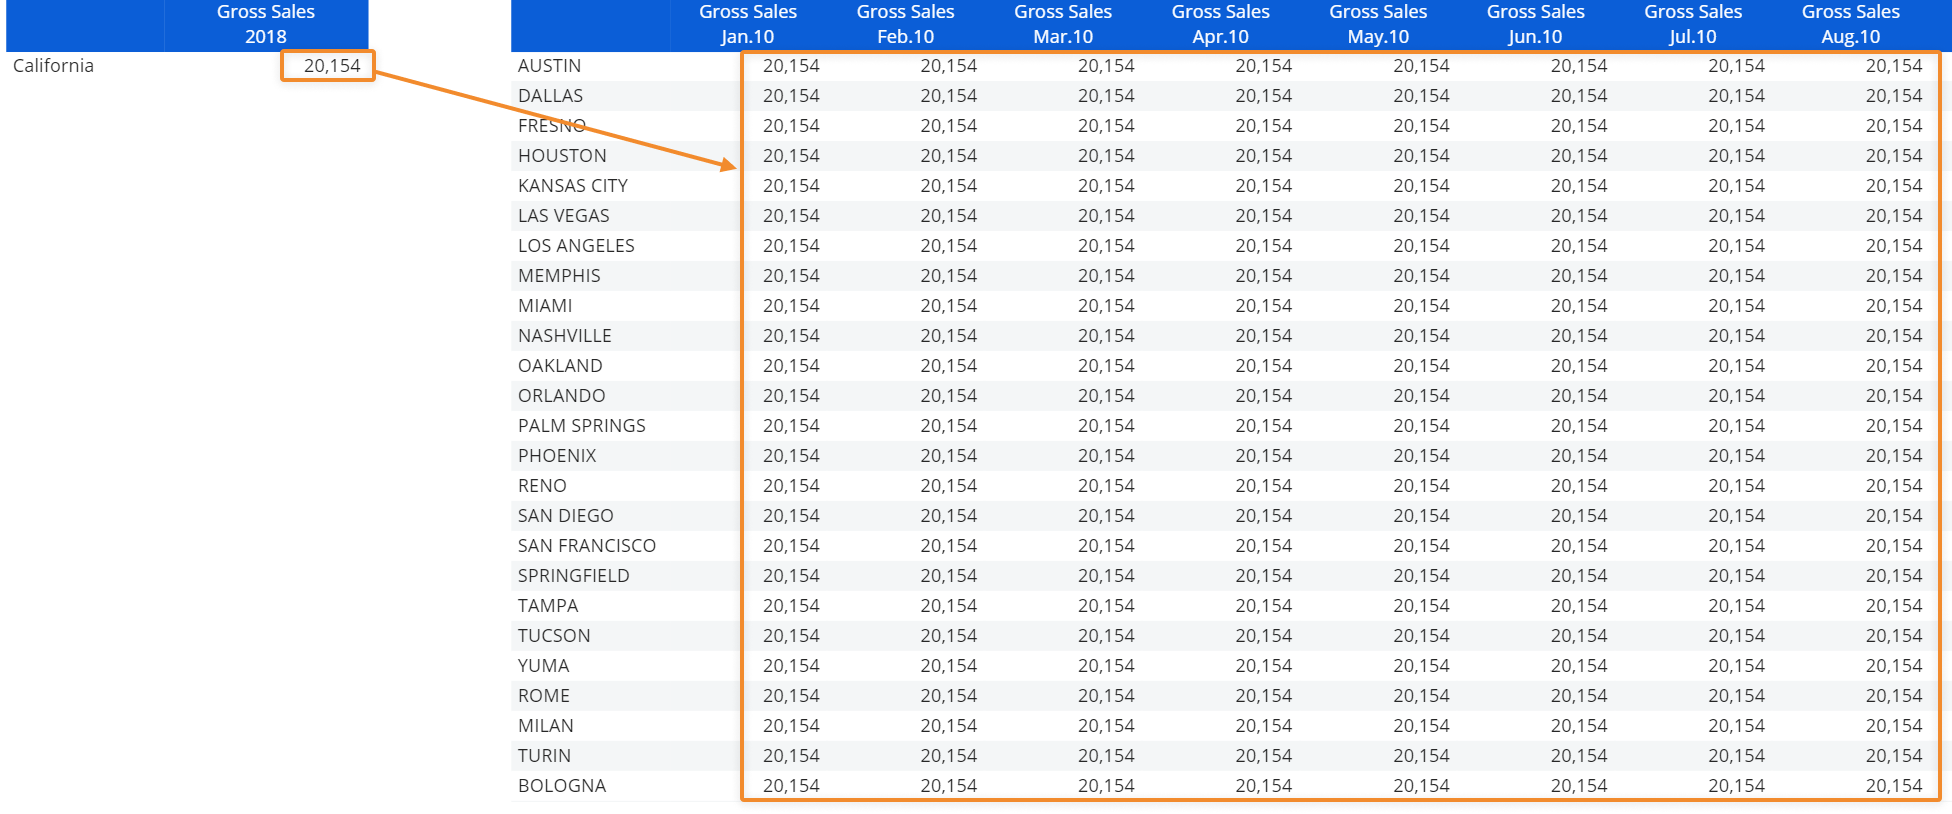
Example
If you set a "refer to" condition on the "California" member of the State Entity, the function will return data for that state regardless of rows, columns and selection settings as shown below:

Here's the configuration in the Layout editor:
There are no limitation on the number of "refer to" conditions you can configure on a Data Block, as long as they don't limit each other: for example, if you set a "refer to" condition on the "Italy" member of the Country Entity and then you set another condition on the "San Francisco" member of the City Entity, you will get empty cells as a result.
The "Refer to" function can also be used to obtain totals: if you configure a "refer to" condition on an Entity that is more aggregate than the Entities set by row or by column, the function returns the referred occurrence value. For example, if you set a "refer to" condition on the Year and State Entity in a Layout where the Month and City Entities are set by column and row respectively, the function will return the total value for the referred year and state in all cells.
Example
Here's the configuration in the Layout editor:
Rules
Under the "Rules" menu it is possible to apply a Rule to a Data Block. The Rule chosen from this menu is uniquely associated with the selected Data Block, contrary to what happens when you drag and drop a Rule from the data panel into the data area of the Layout Editor.
Using a rule, it is possible to define a specific member as the result of a formula involving other members of the same Entity.
Quick Tips about Rules
- A Rule is always associated with a single Entity and can only be applied to Cubes that have that Entity as a dimension in their structure
- Rules must be used in a Layout with their associated Entity set By Row or By Column
- An Entity must always be set by Row for a Rule to execute
- If the Entity is set By Row, it is possible to add another Entity By Row as a grouping Entity (i.e. the one in the leftmost position in the "BY ROW" field), meaning that the Entity in which the Rule is defined must always be in the most-nested (rightmost) position. Those Entities must not be part of the same hierarchy.
- It is not possible to add another Entity By Column if the Entity in which the Rule id defined is set by Column
See Rules for more details and requirements.
The following options are available in the "Rules" menu:
- Apply on totals. If activated, it applies the Rule also on totals
- Rollup. Enables the automatic roll-up on the Data Block. A Roll-up Entity is an Entity whose members have a hierarchical coding structure. When a Roll-up Entity is used in a report, Board will automatically calculate totals and subtotals on rows which are "parent" of "child" rows (i.e. the code of an occurrence represents the beginning of the code of other members that are at a more detailed level)
- Disable unbalanced hierarchy. Disables the unbalanced hierarchy aggregation on the Data Block
Detail by
The Detail by option allows you to select an Entity by which to display data across all columns. This option overrides any By Column settings defined in the Axis area of the Layout editor.
It is also possible to sort values using the "Order" menu. The following settings are available:
- Not sorted (default). No sorting applied
- Descending. Returns values from bottom to top considering only n columns, where n is the number defined in the "Keep top" field
- Ascending. Returns the function results from top to bottom considering only n columns, where n is the number defined in the "Keep top" field
Example
Consider the following report:

The Gross Sales values are shown by Channel (in columns) and by Year (in rows).
Here's the report's configuration in the Layout editor:
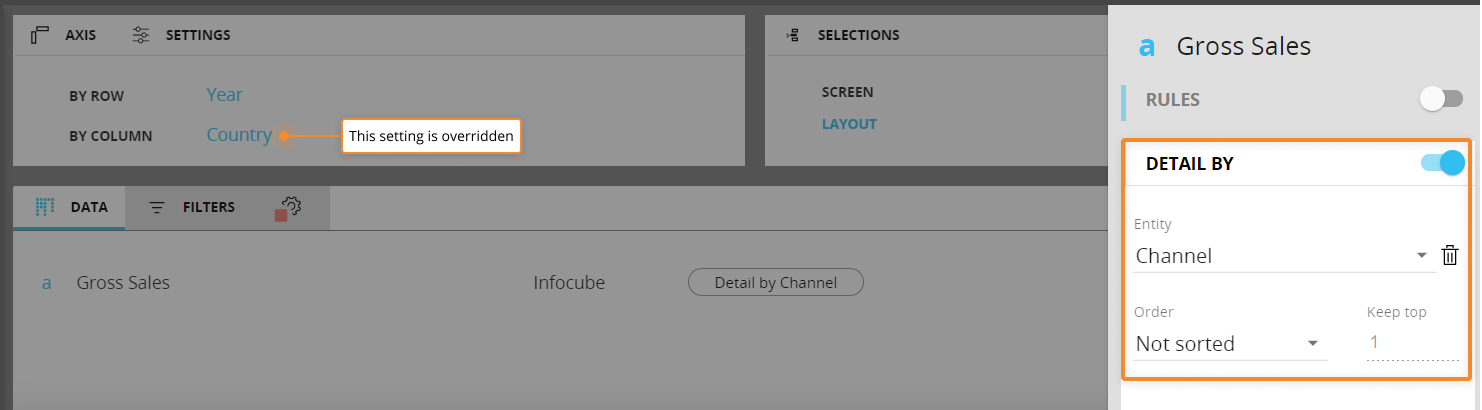
As you can see, the "BY COLUMN" Entity is overridden by the "Detail by" function settings.
Total by
The Total by function allows a Cube to be aggregated at a higher level than the Entities in the Axis area. This function is particularly useful for calculating percentages and other indicators.
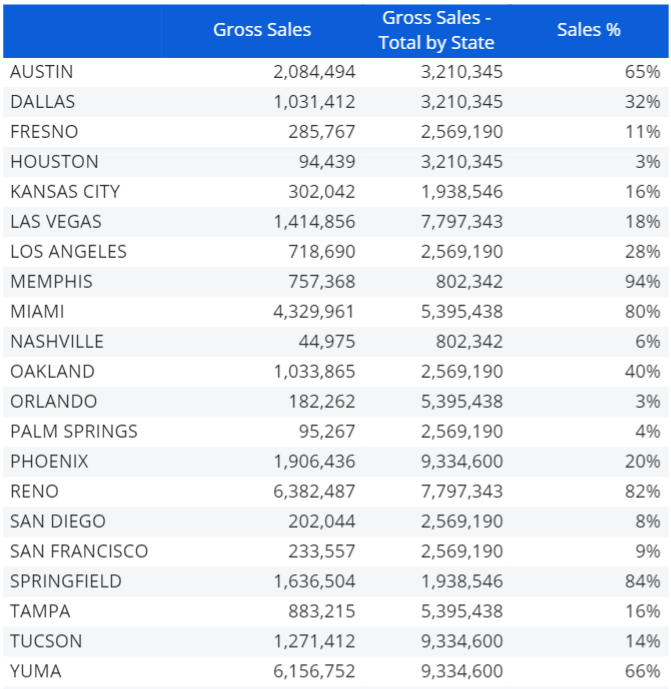
Example
Consider the report below, where:
- The City Entity has been added by row
- The first column shows sales values
- The second column shows sales values with the "Total by" function applied on the State Entity. This configuration returns the total sales value for each State the corresponding city belongs to
- The third column calculates the percentage of sales for each city against the total sales for the State it belongs to
Here's the configuration in the Layout editor:
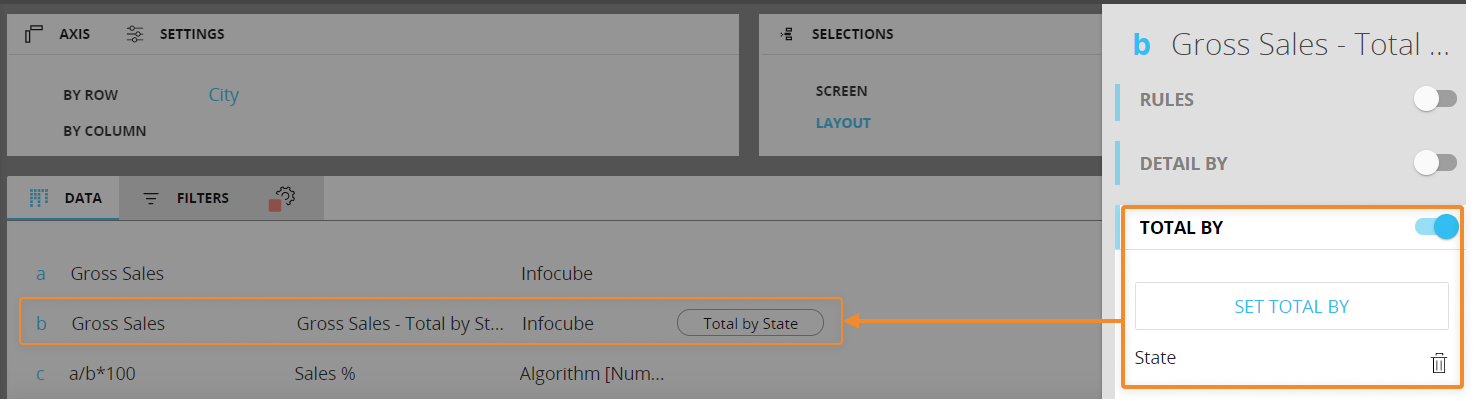
As you can see, the "Total by" function allows Block "b" values to be shown at a higher level of aggregation than the Entity City set by row, thus allowing an easier calculation of the percentage in Block "c".
Aggregation
Under the "Aggregation" menu it is possible to apply an aggregation function to a Data Block.
The available functions are the following:
- Sum. Returns the sum for the selected Entity. For example, in a report configured by Product Group and Month, the sum function on the Entity Product will return the sum of products sold for each Product Group detailed by month
- Distinct count. Returns the distinct item count for the selected Entity on every cell. For example, in a report configured by Customer and Month, a distinct count function on the Entity Product will return the distinct number of products sold for each Customer detailed by month
- Average. Returns the average value for the selected Entity, where average = sum/distinct count
The user can filter the entity members considered by the function using the "Limit to" options:
- None (default). No filters applied
- Top. Returns the function results from top to bottom considering only n Entity members, where n is the number defined in the "Item count" field
- Bottom. Returns the function results from bottom to top considering only n Entity members, where n is the number defined in the "Item count" field
- Range. Returns the function results from a range of Entity members defined by the "From" and "To" fields
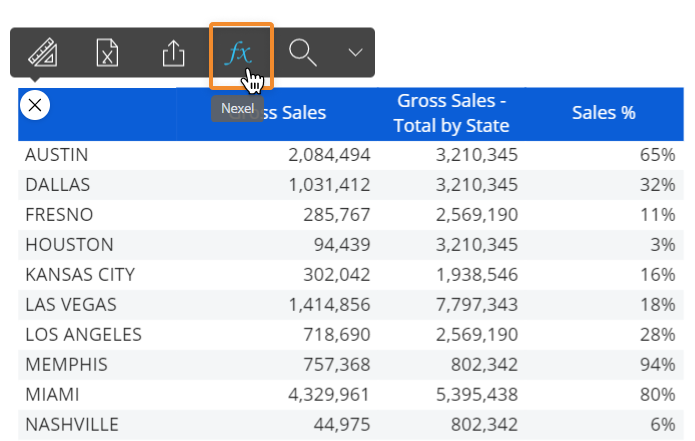
Nexel
Nexel combines the flexibility and the versatility of a spreadsheet-like application with the power and robustness of a multidimensional object as the Data View. It offers a wide library of formulas embedded in the reporting layer to provide additional calculation capabilities on columns, ranges of cells and even single cells.
Nexel formulas are equations that can perform calculations, return information, manipulate cell content, test conditions, and more. Formulas always starts with an equal sign (=) and are supported by Data Blocks containing:
- A Cube
- An algorithm
- Entities & Relationships
The result of a Nexel Formula overlaps any value generated by a Layout definition.
Under the "Nexel" menu in the Block settings panel it is possible to enable and configure the NEXEL layer for the selected Block. When enabled, it is also possible to define how the formula will be propagated to the cells of the Block. Two options are available:
- Deepest entity formula (default). Each cell of the Block can have a different formula
- Single formula. The formula is the same for all cells of the Block
Once enabled, the configuration is done from the sliding toolbar of the Data View: