The Google Maps Object
The Google Maps Object gives you the ability to display your multidimensional data on an interactive map based on Google Maps: it allows you to visualize data from Board and interact with it using the popular Google web mapping platform.
This Object allows you to position your data in a geographical context and, using different layers, it provides at-a-glance information in a visual way thanks to markers (Bubbles) and color conditional formatting.
Based on your data, Board automatically calculates the size of markers and their color can be dynamically configured or customized according to your preferences. The Google Maps Object supports up to 20 different zoom detail levels.
Due to a Google Maps security content update, the Google Maps Objects will only work with versions 12.6 or newer. Further details on the update can be found here. If you have any concerns regarding the Google Maps Object, please reach out to your Customer Success Manager.
Examples
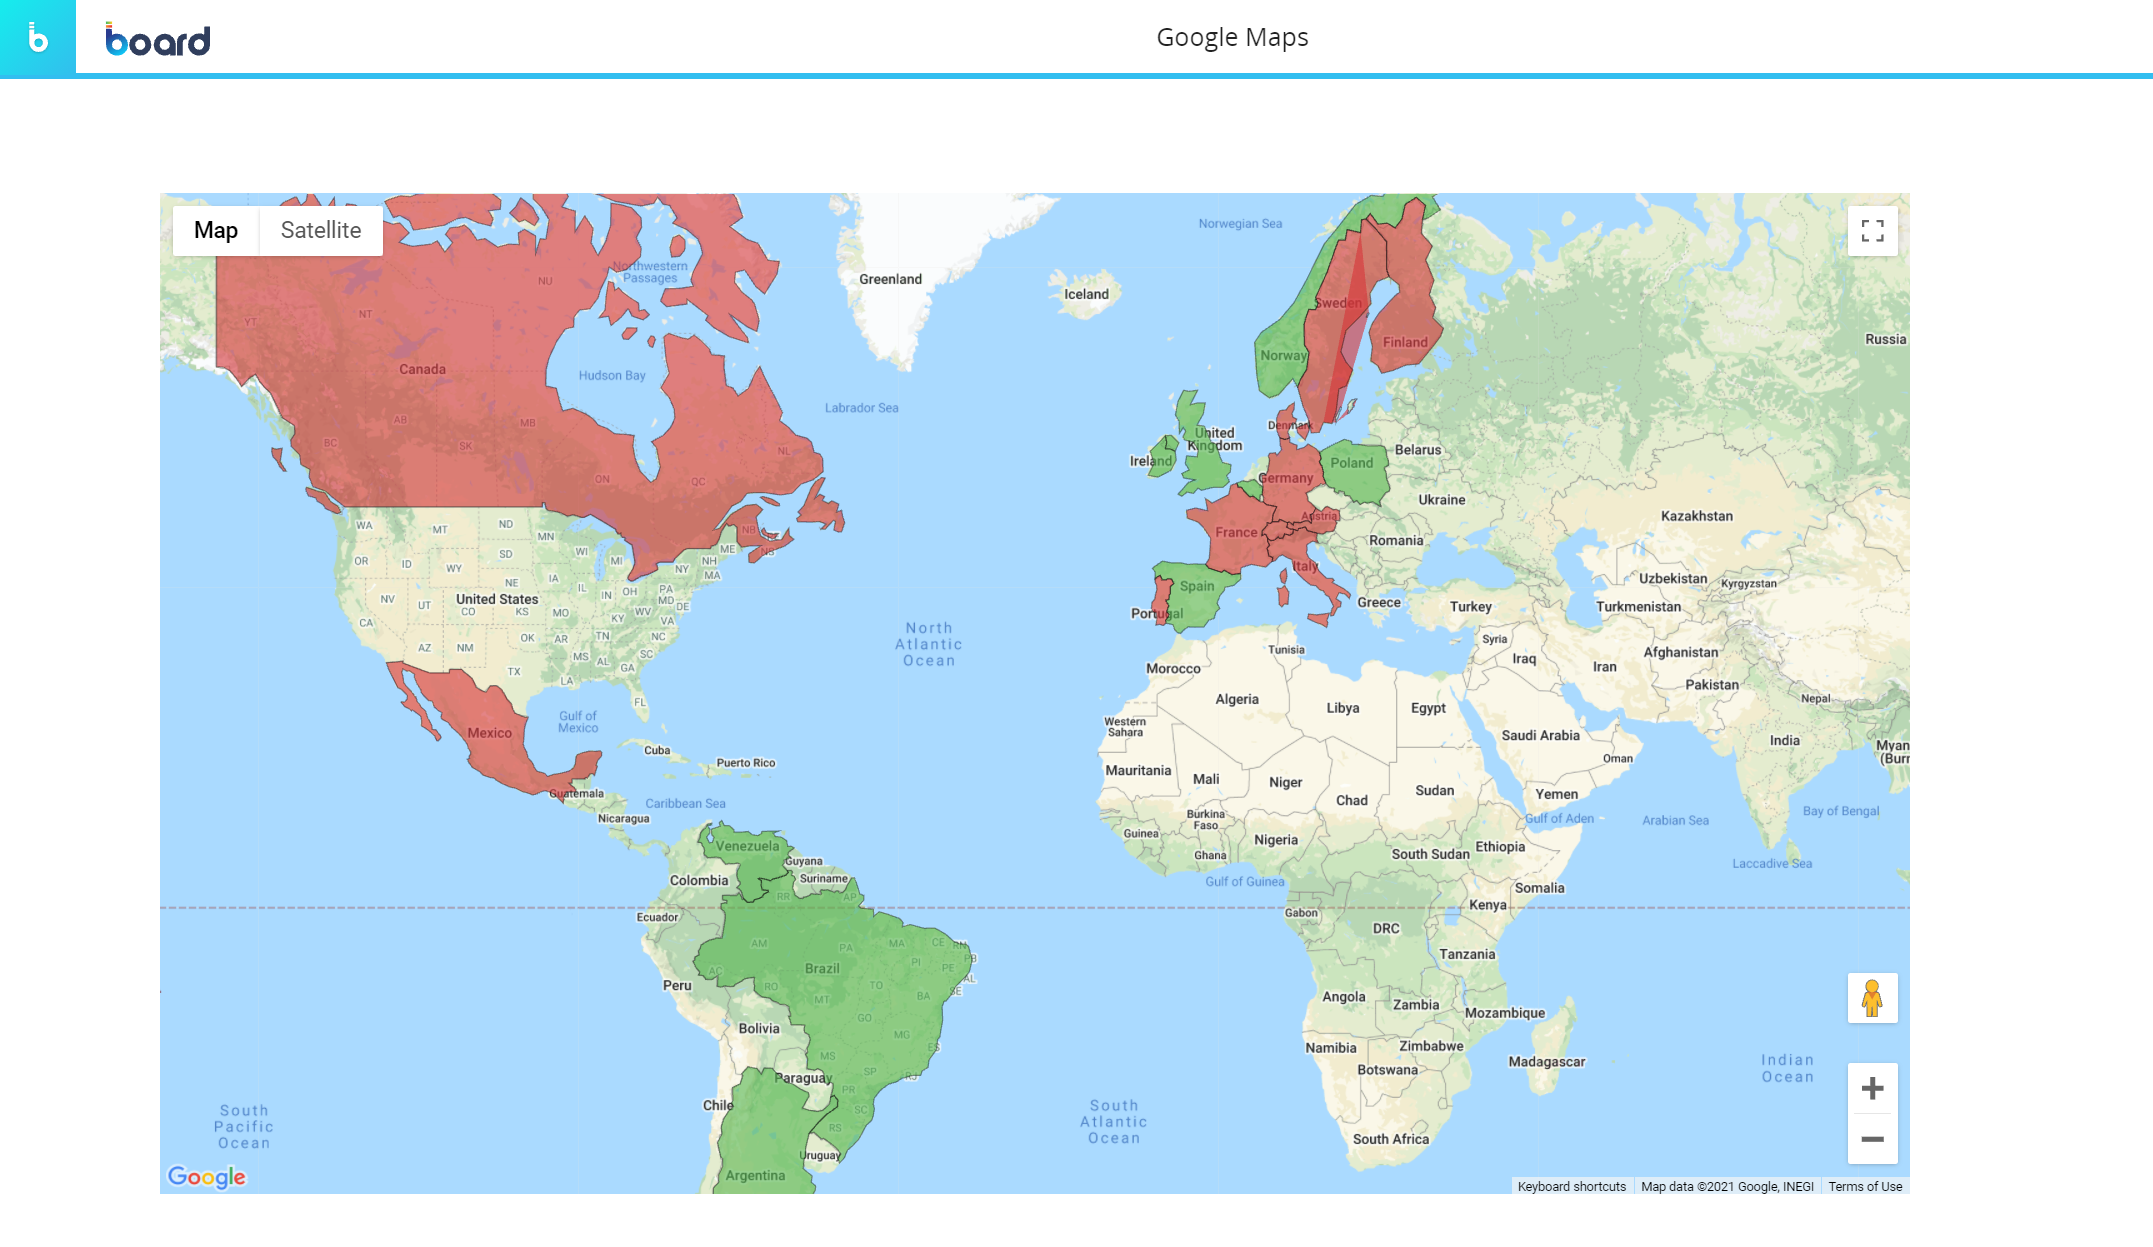
The following picture shows a Google Maps Object with a color alert set on a target value and applied to map areas (countries).
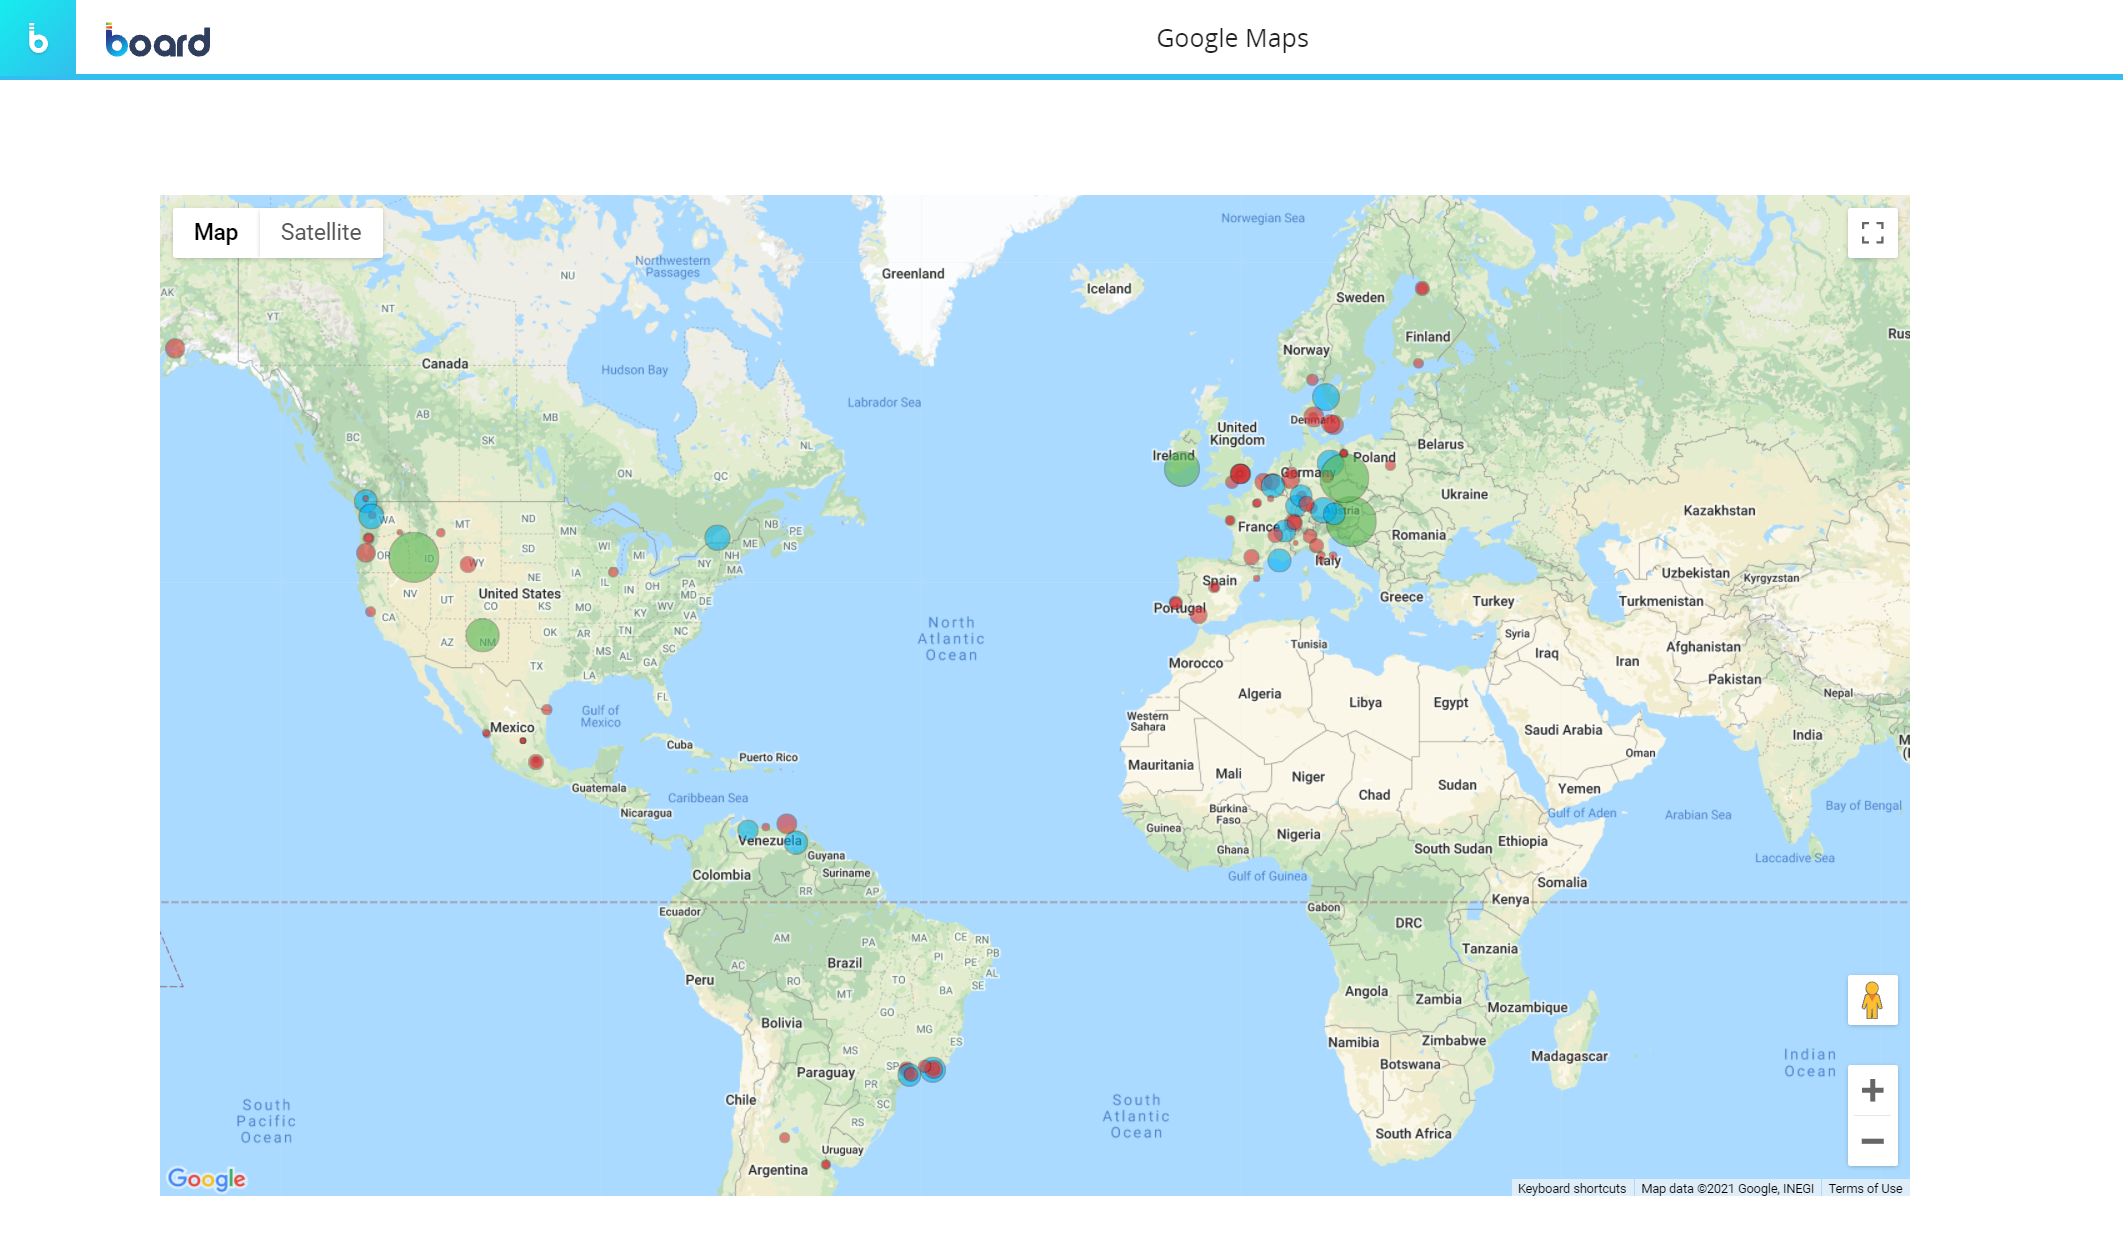
The following picture shows a Google Maps Object with color conditional formatting set on a target value and applied to Bubbles. The Bubbles radius represents other data configured in the Layout.
Learn more about: