Creating an Svg map Object
This topic describes how to add a new Svg map Object to a Screen or a Container and its specific properties.
To create a new Svg map, you need to access a Screen in Design mode.
Once you're in the Screen editing page, locate the Svg map Object from the Screen Objects list in the left panel, then drag and drop it onto your Screen or Container.
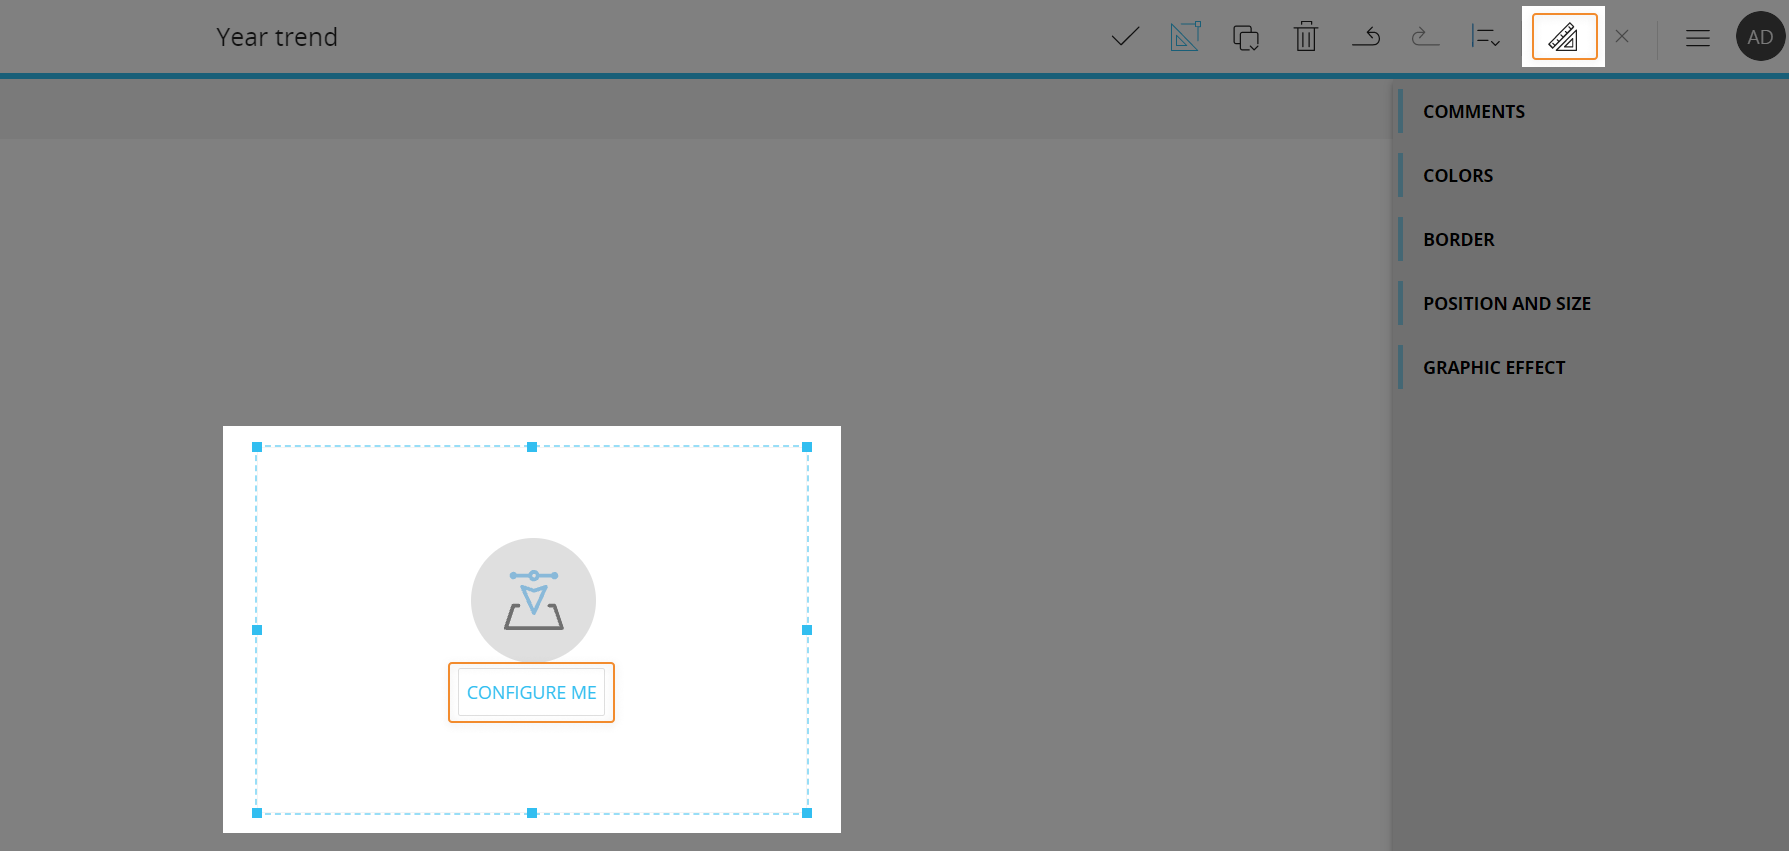
When you create an Svg map, it is initially empty. The next step is to configure a Layout that will define the data to be displayed in the map. To do so, click the "Configure me" button or select the Svg map Object and click the "Configure layout" button (![]() ) located in the Top Menu of the Capsules workspace.
) located in the Top Menu of the Capsules workspace.
See The Layout Object, Configure a Layout and About data blocks of a Layout for more details on the Layout Object.
The Svg map, just like every other Object, can be moved, resized, duplicated via copy/paste and easily aligned with other Objects on the Screen.
See Configure Screen Objects for more details.
Svg map Layout
The Layout editor for Svg map Object is slightly different from the classic one, in that it offers map-specific options and must contain specific Data Blocks needed for mapping.
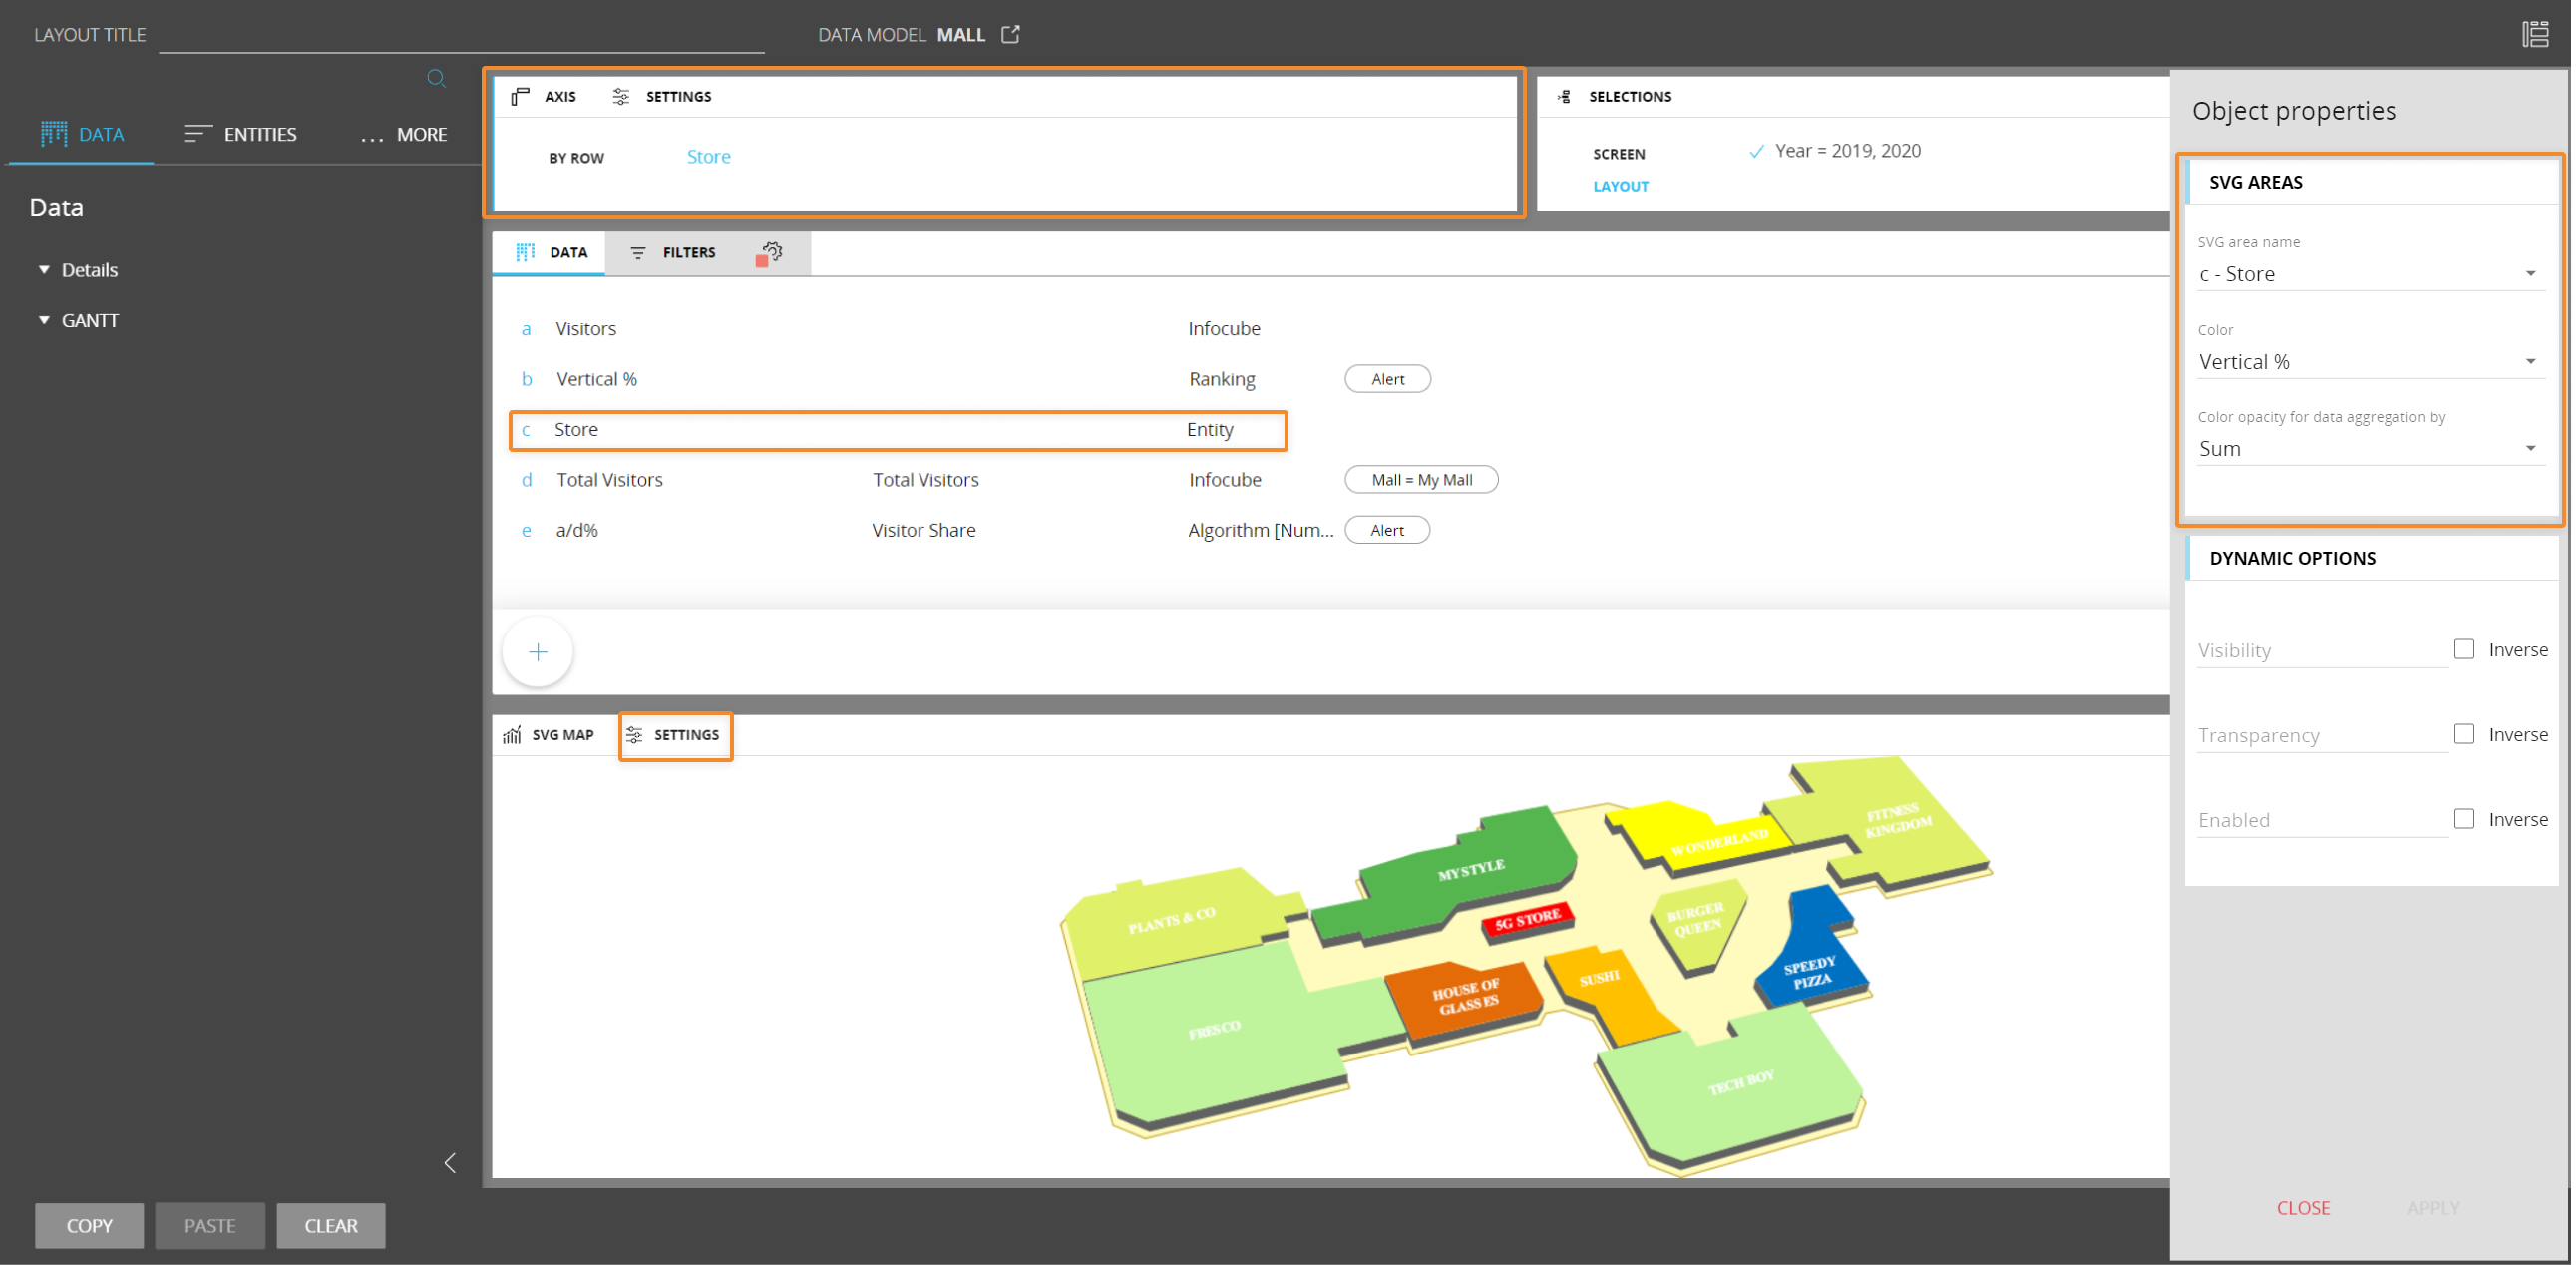
The main elements that should be considered are highlighted in the image below:
The Axis area
In the Axis area you can add Entities that will be used to associate your data with different map areas.
The Svg map Object supports up to 2 Entities in the "By row" field.
For area mapping using an Entity/Text Block whose members/text strings are mapped to IDs of SVG areas in an SVG map file, you need to include the Entity/Text Block in the Layout and select it in the "SVG area name" dropdown under the "SVG Areas" menu. See Object properties and Manage SVG for more details.
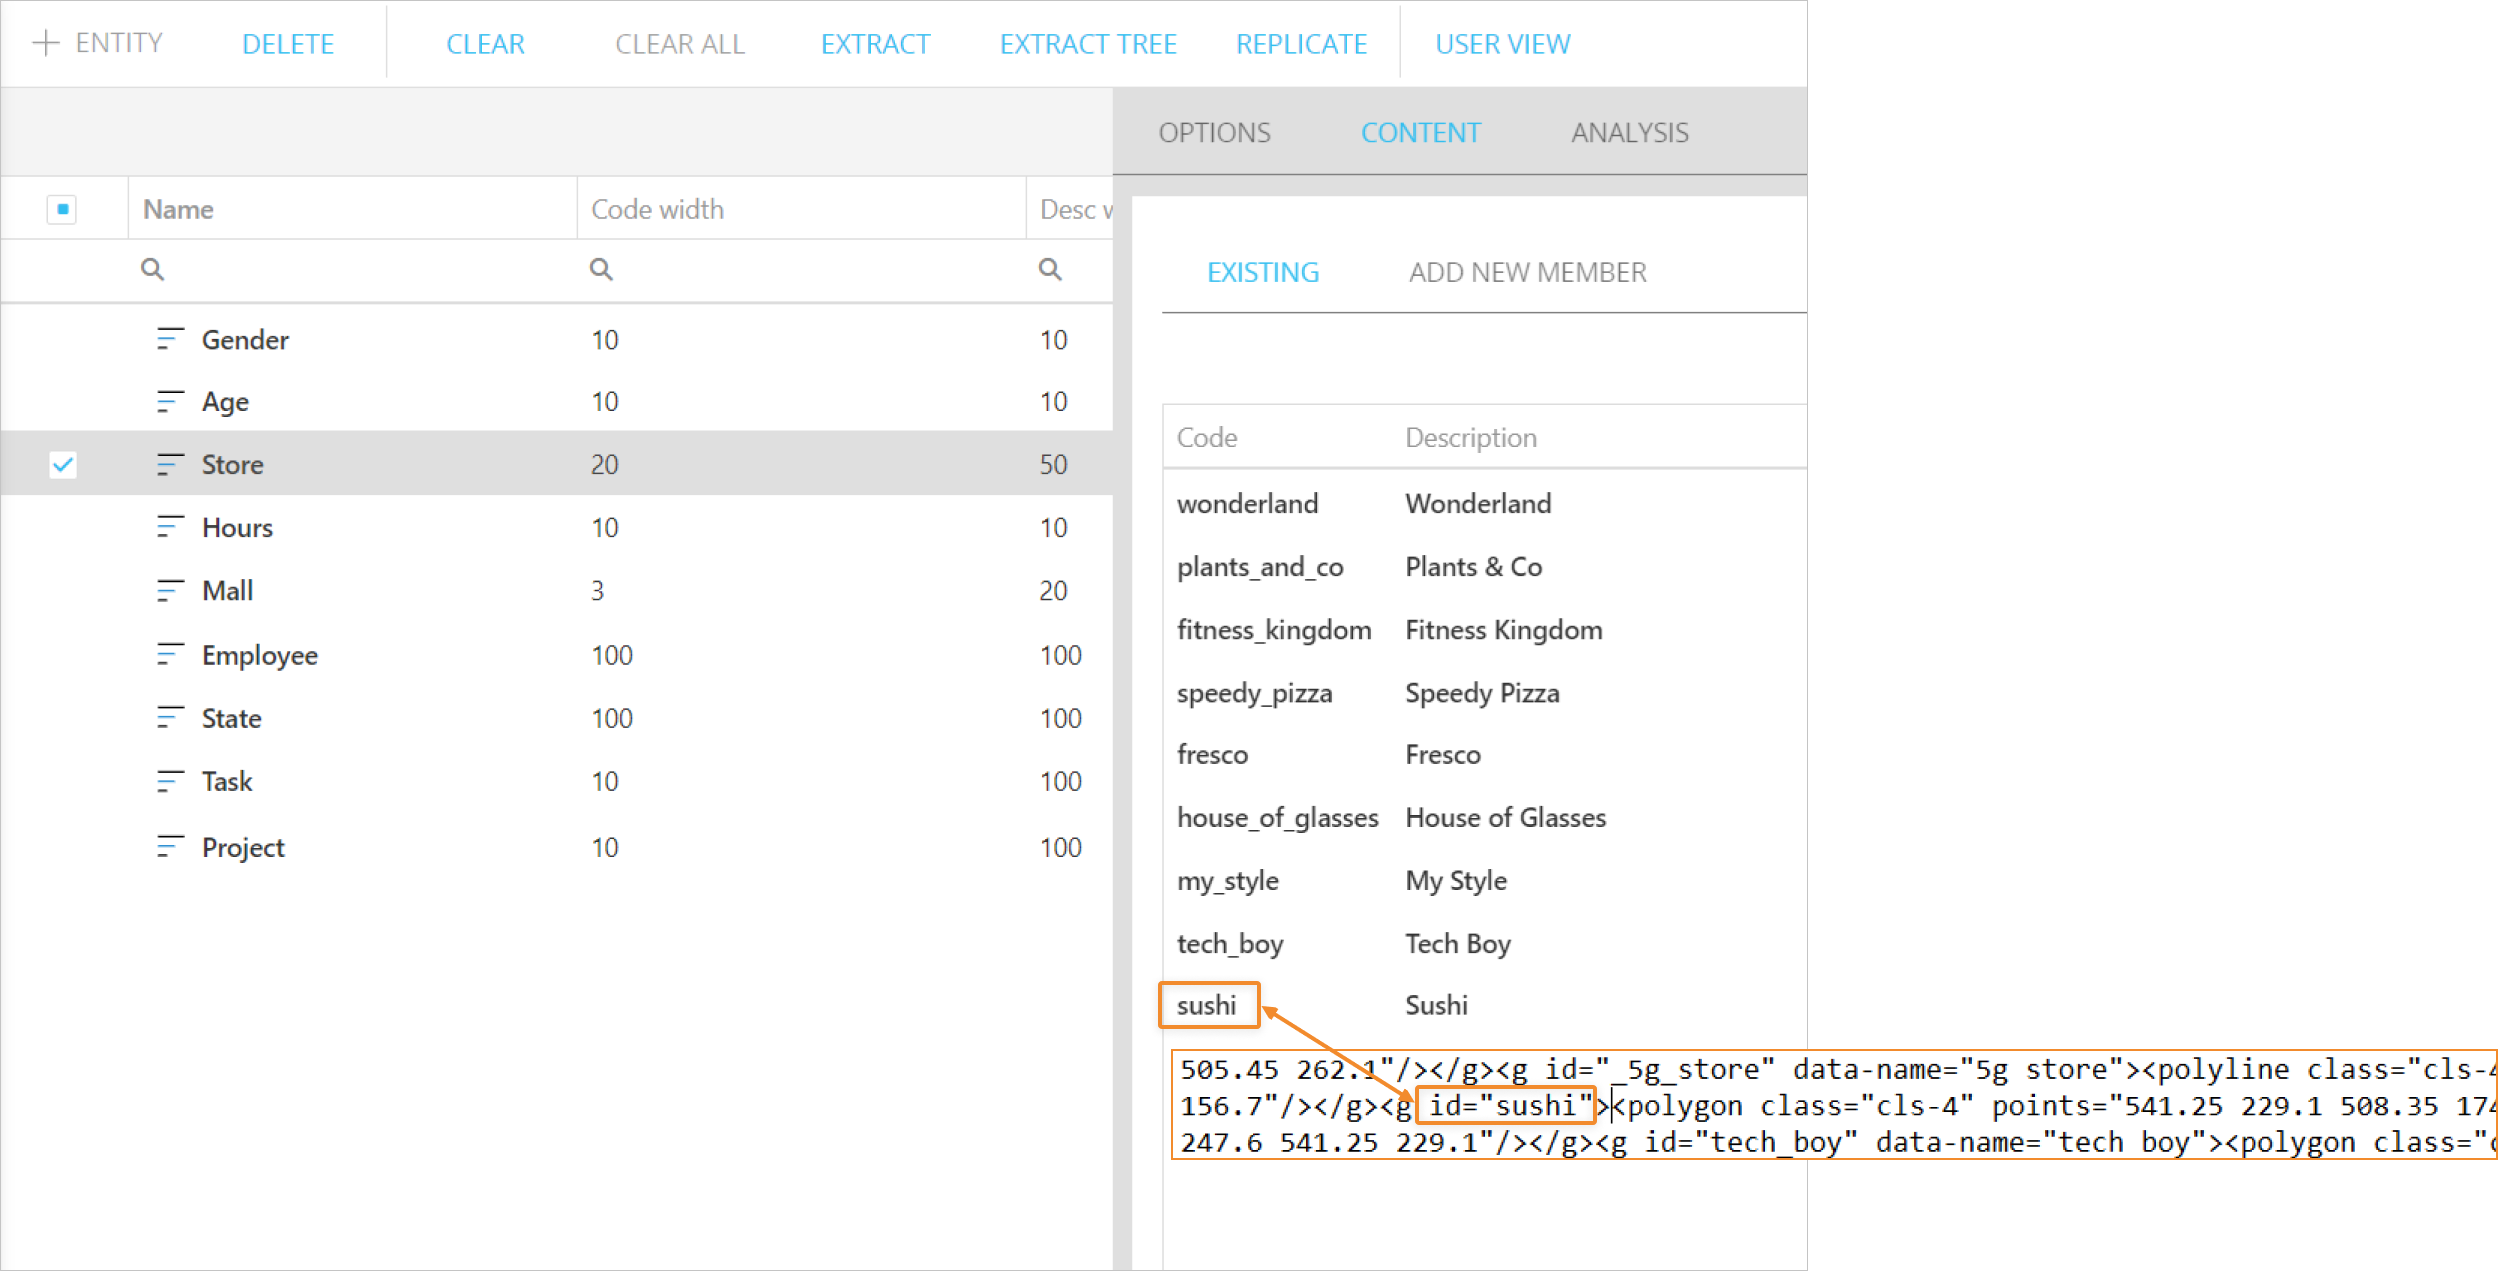
The SVG map file must contain a <g> SVG element for each SVG area you need mapped. In particular, every <g> element must include a unique ID for the corresponding SVG area.
The Data area
Area mapping is achieved using an Entity/Text Block whose members/text strings are mapped to IDs of SVG areas in the SVG map file.
To do so, an Entity/Text Block whose members/text strings are mapped to IDs of SVG areas in the map must be added to the Layout. Then, you have to select it in the "SVG area name" dropdown under the "SVG Areas" menu in the Object properties panel.
The SVG map file must contain IDs and coordinates in a <g> SVG element for each map area while the Entity/Text Block in the Layout must contain the same IDs as member codes (Entity) or text strings (Text Block).
Data Cubes added to the Data area should also have the Entity added to the "By row" field - or another Entity in the same Relationships tree - in their structure.
Example
You want to visualize data about visitors of shops in a department store. The Store Entity contains the IDs of SVG areas of the map as members and the data is loaded in the Visitors Cube which is dimensioned by Month, Gender, Age, Store and Hours.
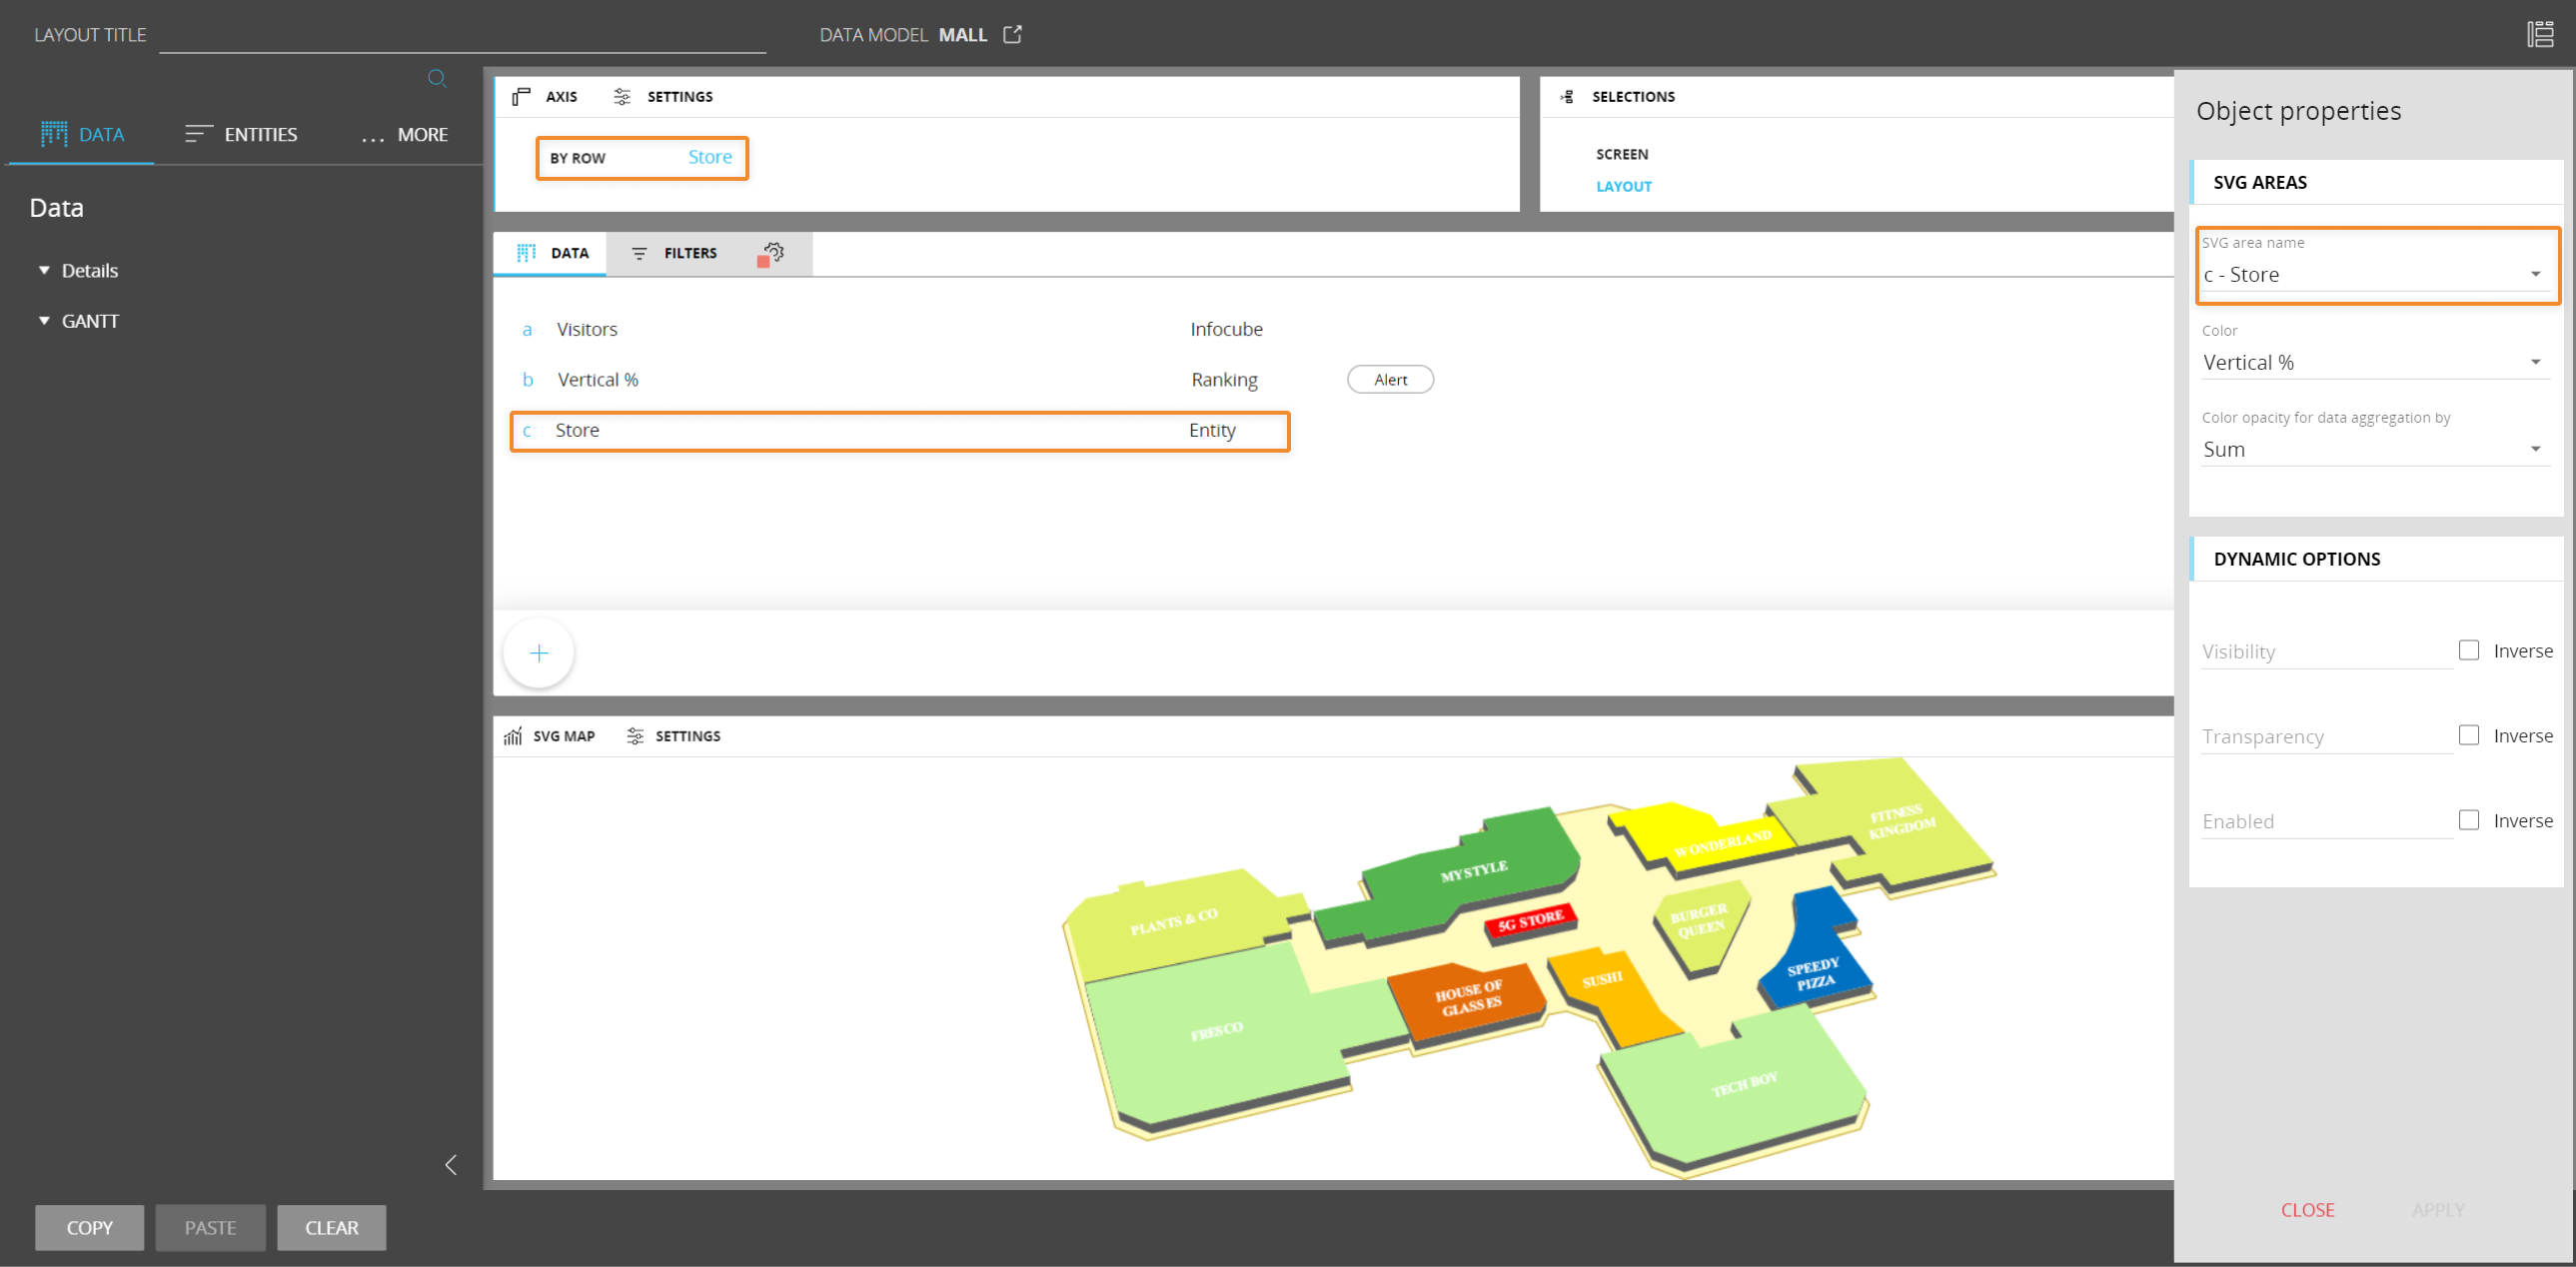
The Store Entity is added to the "By row" field in the Layout and is selected in the "SVG area name" dropdown under the "SVG Areas" menu in the Object properties panel.
The Layout configuration should look as follows:
The Store Entity contains the following members, whose code is also used to identify map areas in the SVG map file:
Data Cubes must have in their structure the Entity added to the "Markers" field or another Entity from the same Relationship tree at any level of aggregation.
Object properties
In the Layout editor, under the Object properties panel, the "SVG areas" menu allows you to configure data visualization as a colored layer over relevant map areas.
The configuration can be done by mapping the Entity/Text Block to labels of SVG areas in the SVG map file via the "SVG area name" field. In the "Color" dropdown menu you can select Blocks from the Layout and use them as drivers for the area's color, while the "Color opacity for data aggregation by" dropdown menu allows you to define a criterion that controls the color opacity.
Svg map properties and settings
Svg map properties are available from the contextual right panel of the Screen editing page once the Object is selected and it's associated with a Layout.
The Svg map Object supports all options common to all Screen Objects and the following properties:
- Master object. If enabled, clicking on a map area will update the data displayed by all other Objects on the Screen in order to show only the data relating to the clicked item. The Master object result is similar to applying a Screen Selection
- Pan and zoom. Enables or disables users controls for panning and zooming, both in Design and Play mode.
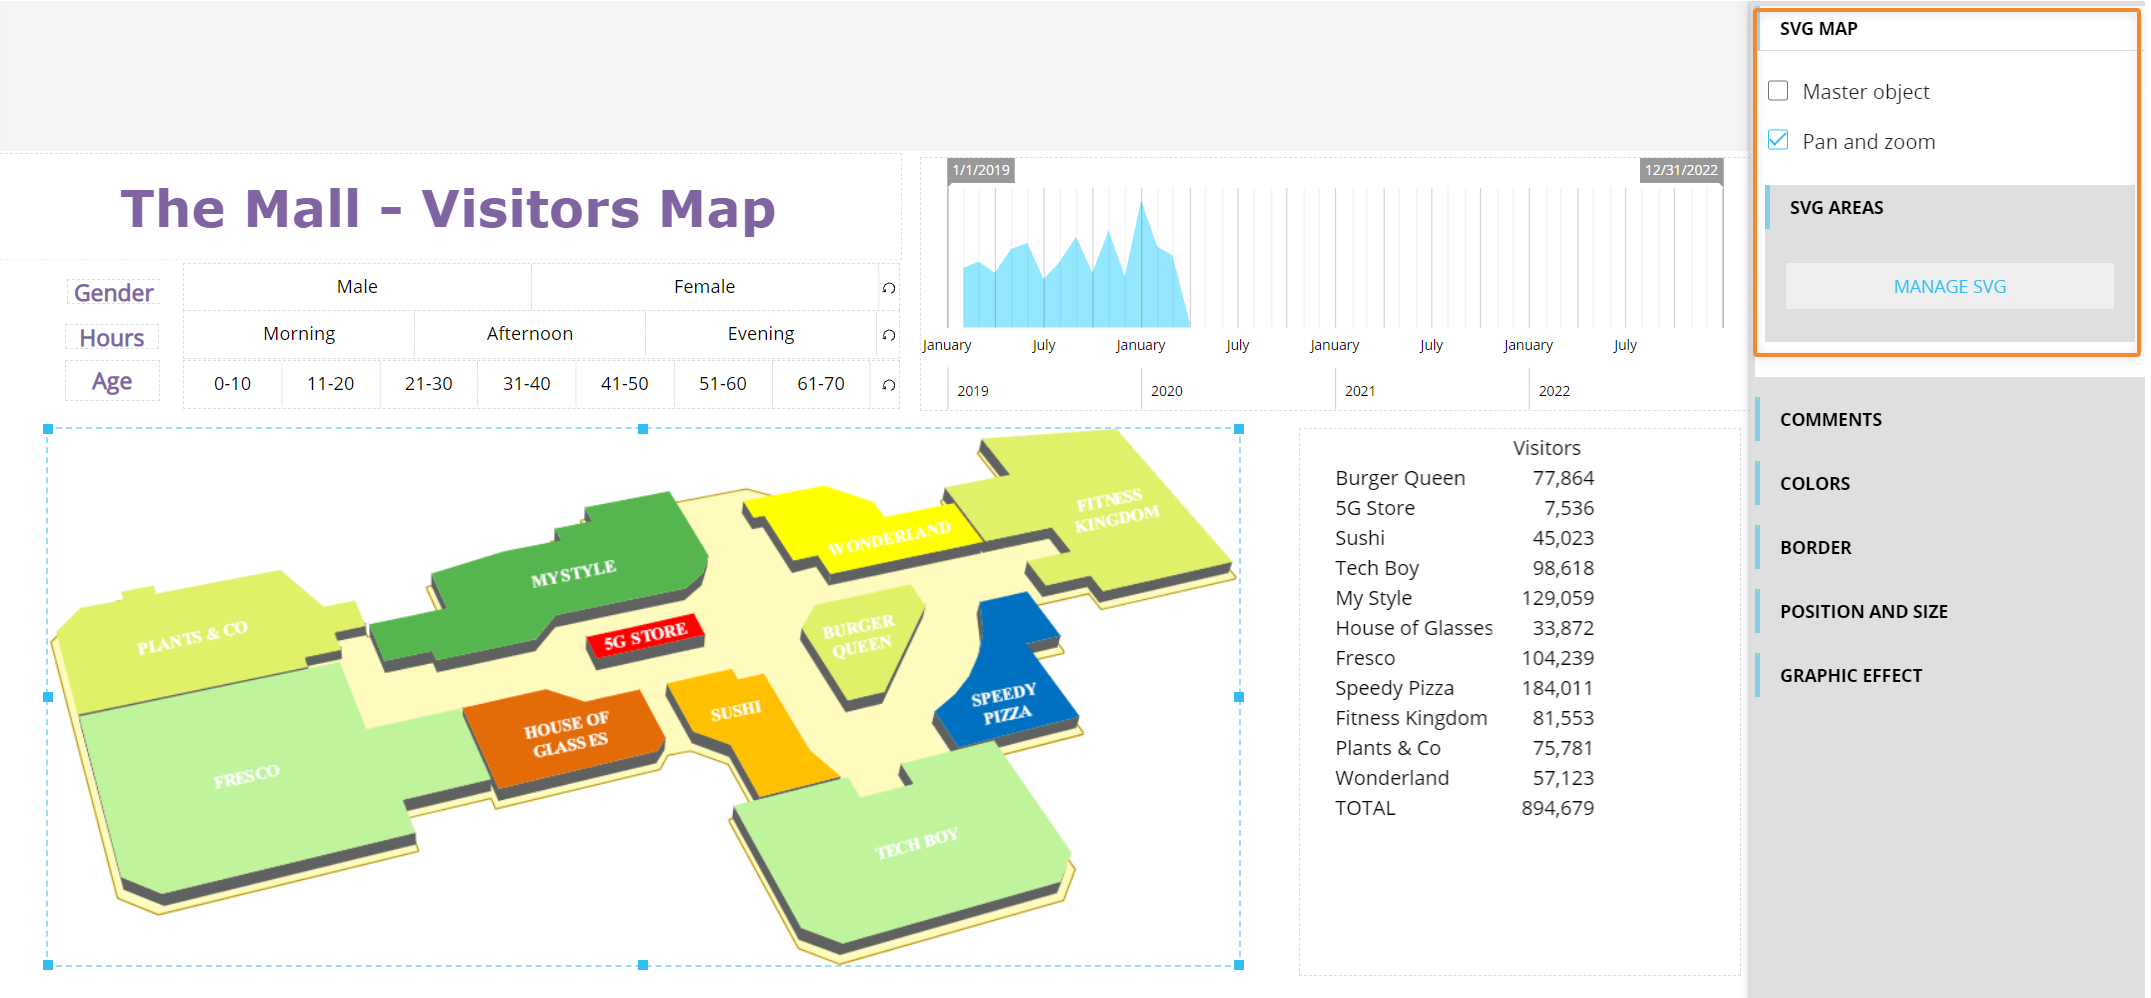
The "MANAGE SVG" button allows you to upload an SVG map file to manage map areas at different levels of detail.
To do so, proceed as follows:
- Click on the button. The SVG map configuration window appears:
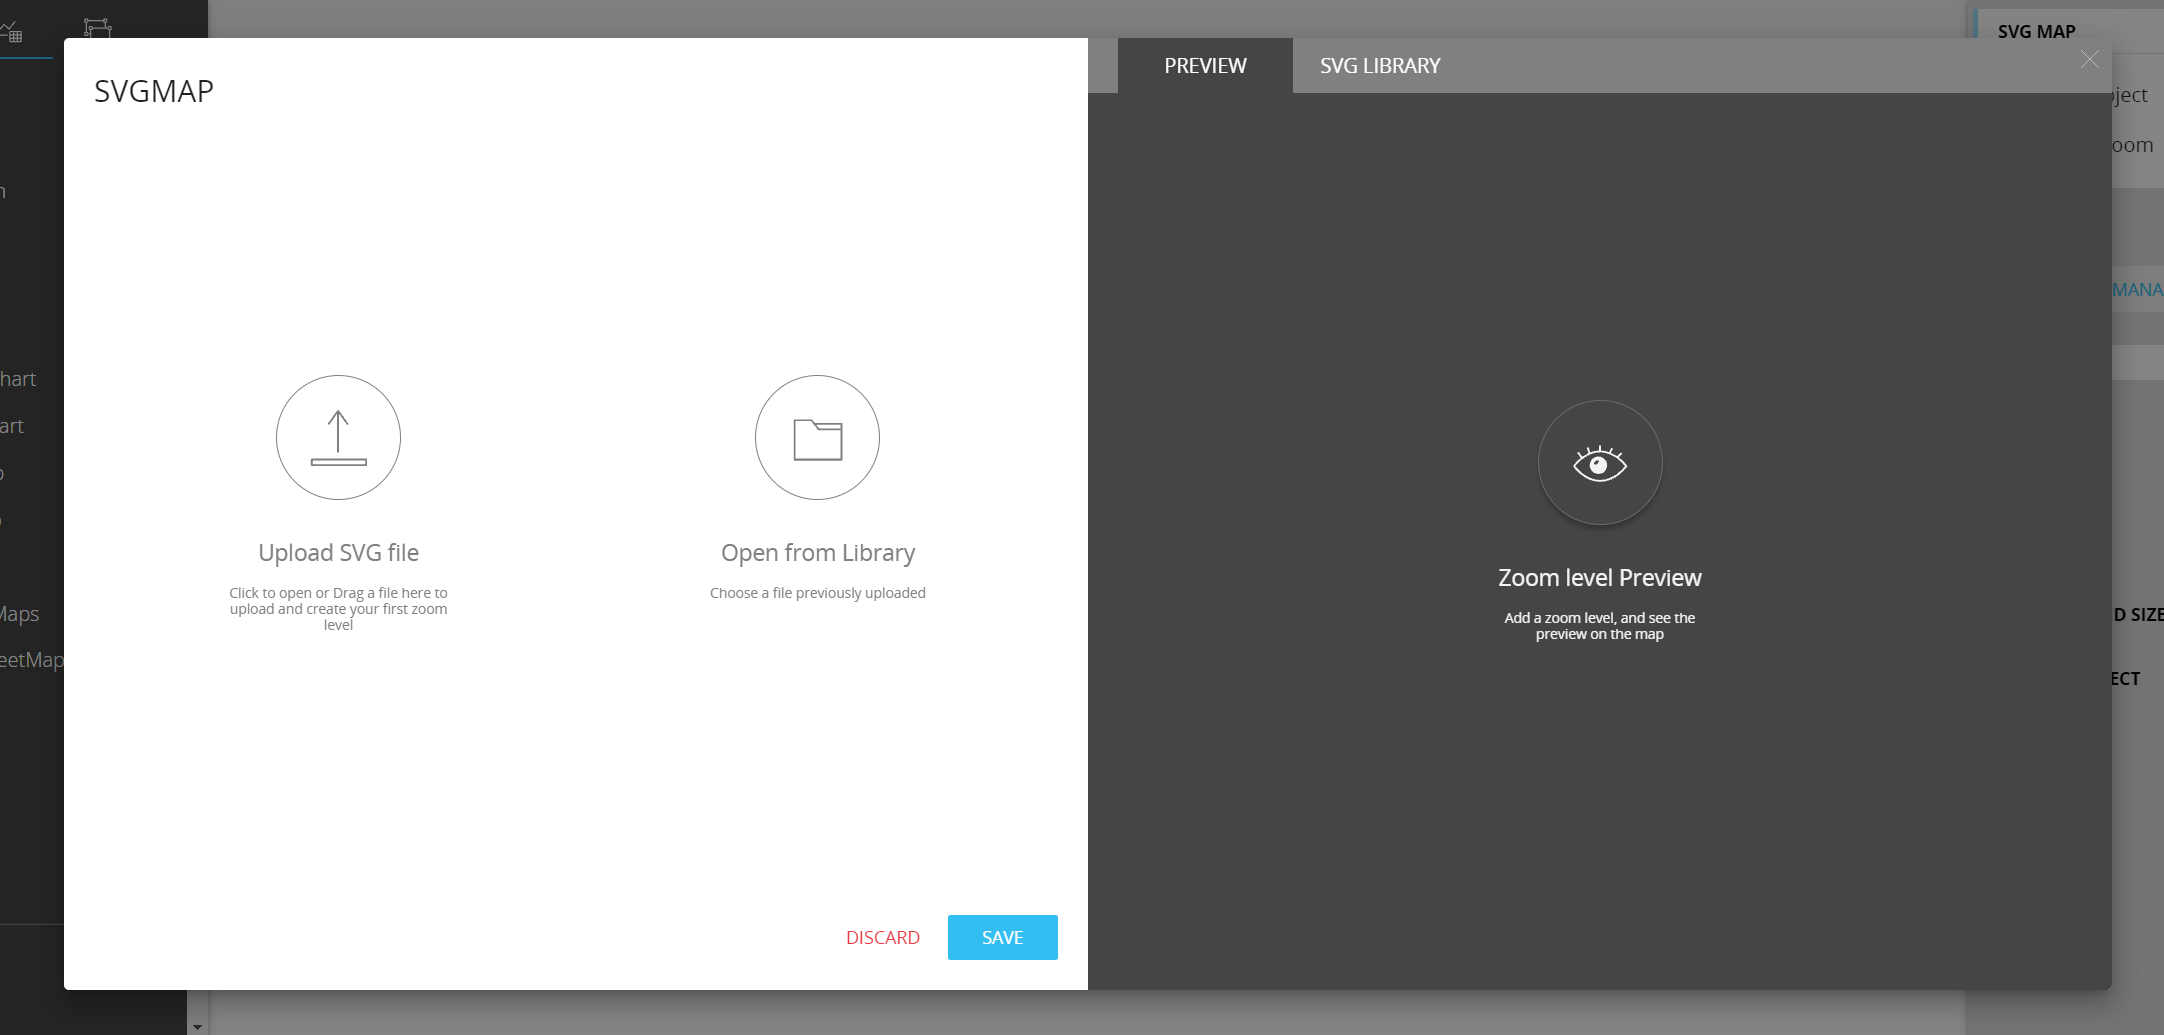
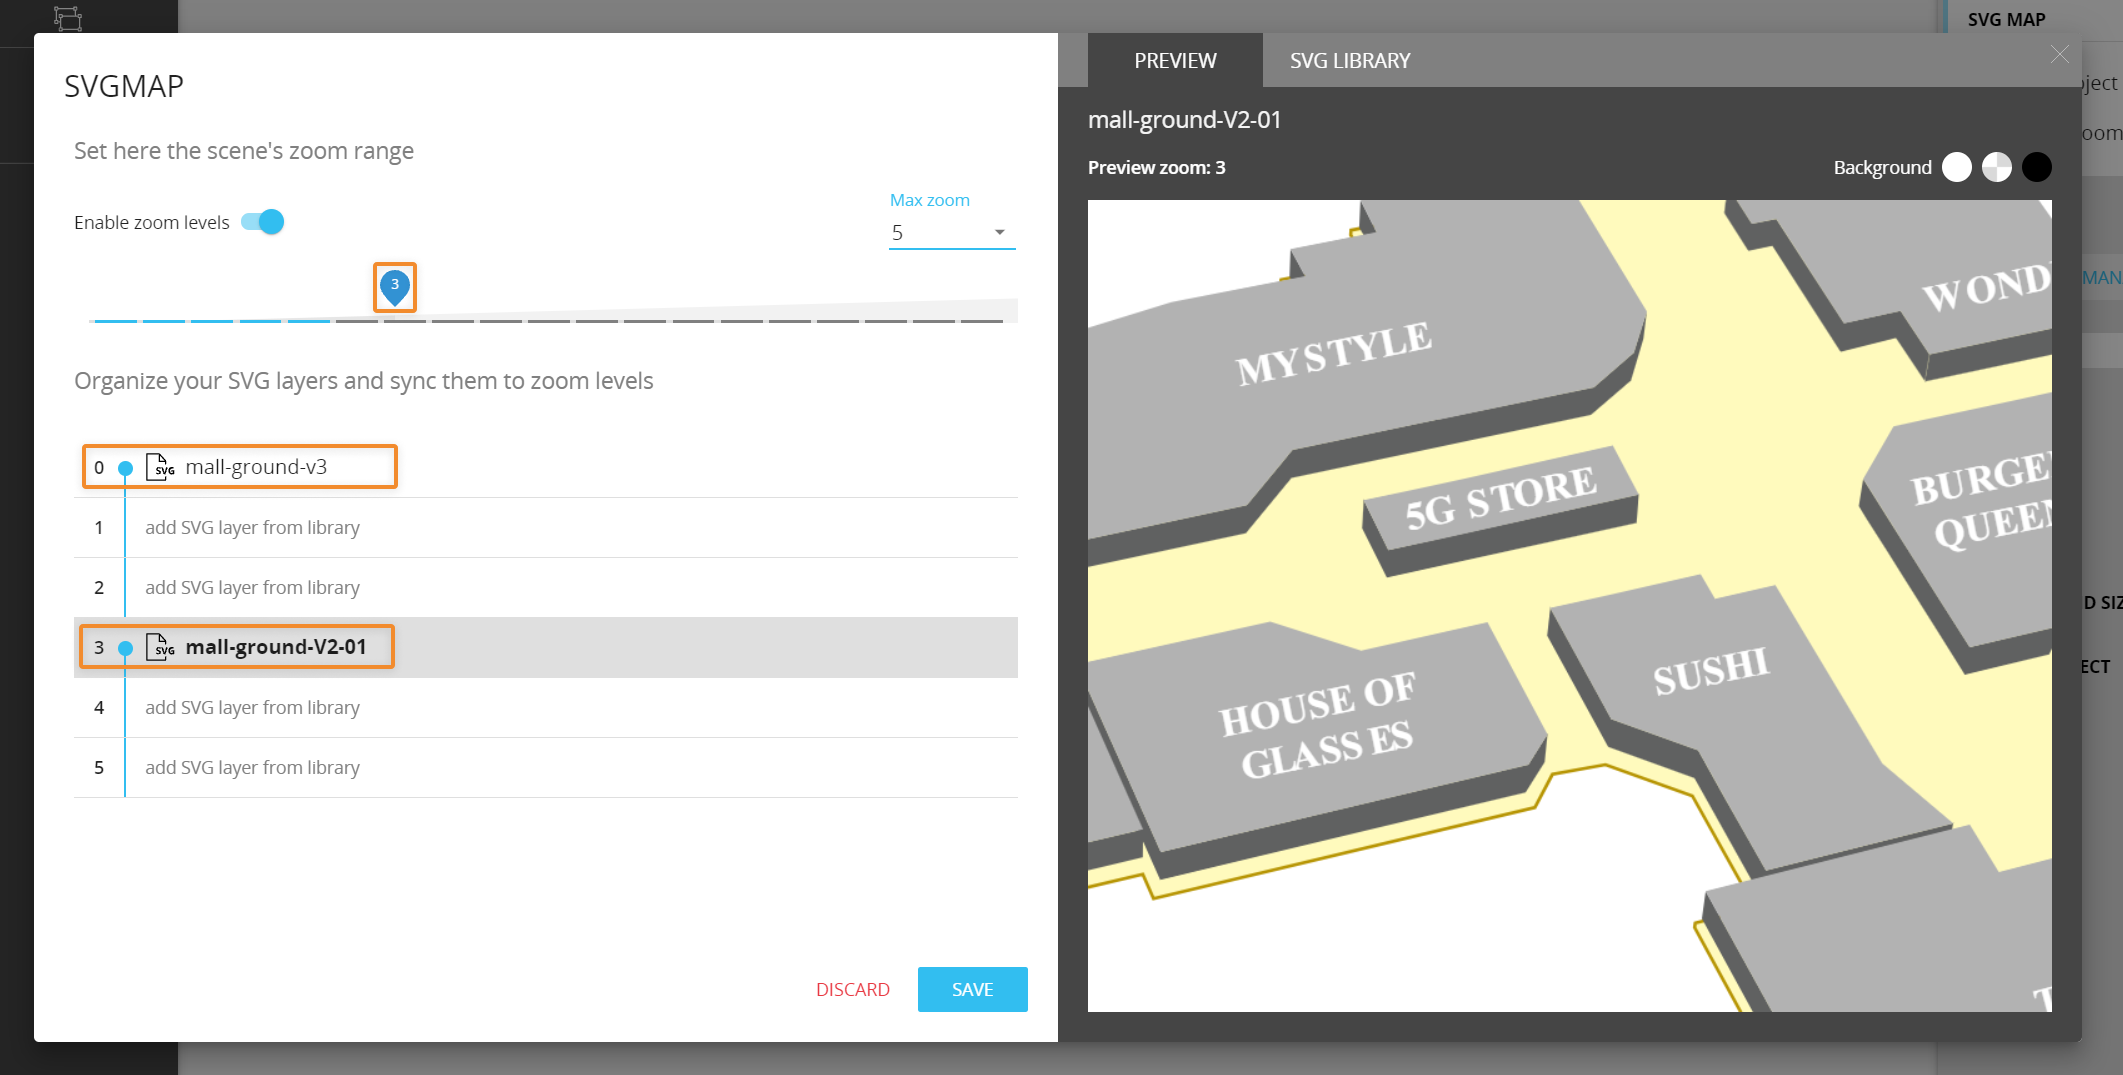
From there you can upload one or more SVG map files to create your Library that will always be available for all Svg map configurations - Once you've uploaded your files (or selected a previously uploaded file from the Library), you can set the maximum zoom level (from 0 to 19) and associate each level with the available Svg maps.
-
Click the SAVE button to save your configuration and close the window.
In the example above an SVG map has been associated with the zoom level 0 and another JSON map with zoom level 3: when users will zoom on the map, at zoom level 3 the more detailed map layer will be displayed according to the configuration.
Interacting with the Svg map in Design mode
In Design mode, the Svg map Object provides the same interactive features available in Play mode.
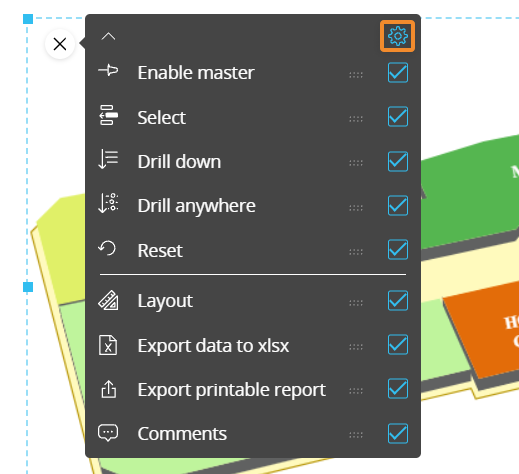
You can also configure which options will be available in the contextual menu (sliding toolbar) in Play mode. To do so, hover over the map and click the contextual menu icon (![]() ) in the top left corner, then expand it by clicking on the downward facing arrow: the configuration panel is accessible from the gear icon in the top right corner.
) in the top left corner, then expand it by clicking on the downward facing arrow: the configuration panel is accessible from the gear icon in the top right corner.
Learn more about: