Svg map
The Svg map Object gives you the ability to display your multidimensional data on an interactive map based on a custom SVG file you upload. With the Svg map you can visualize and interact with data from Board in a geographical context and, using different layers, you get at-a-glance information thanks to color conditional formatting applied to specific map areas.
The Svg map Object supports up to 20 different zoom detail levels and it's useful, for example, when you want to visualize data about shops in a department store or the performance of different business units in a company.
Example
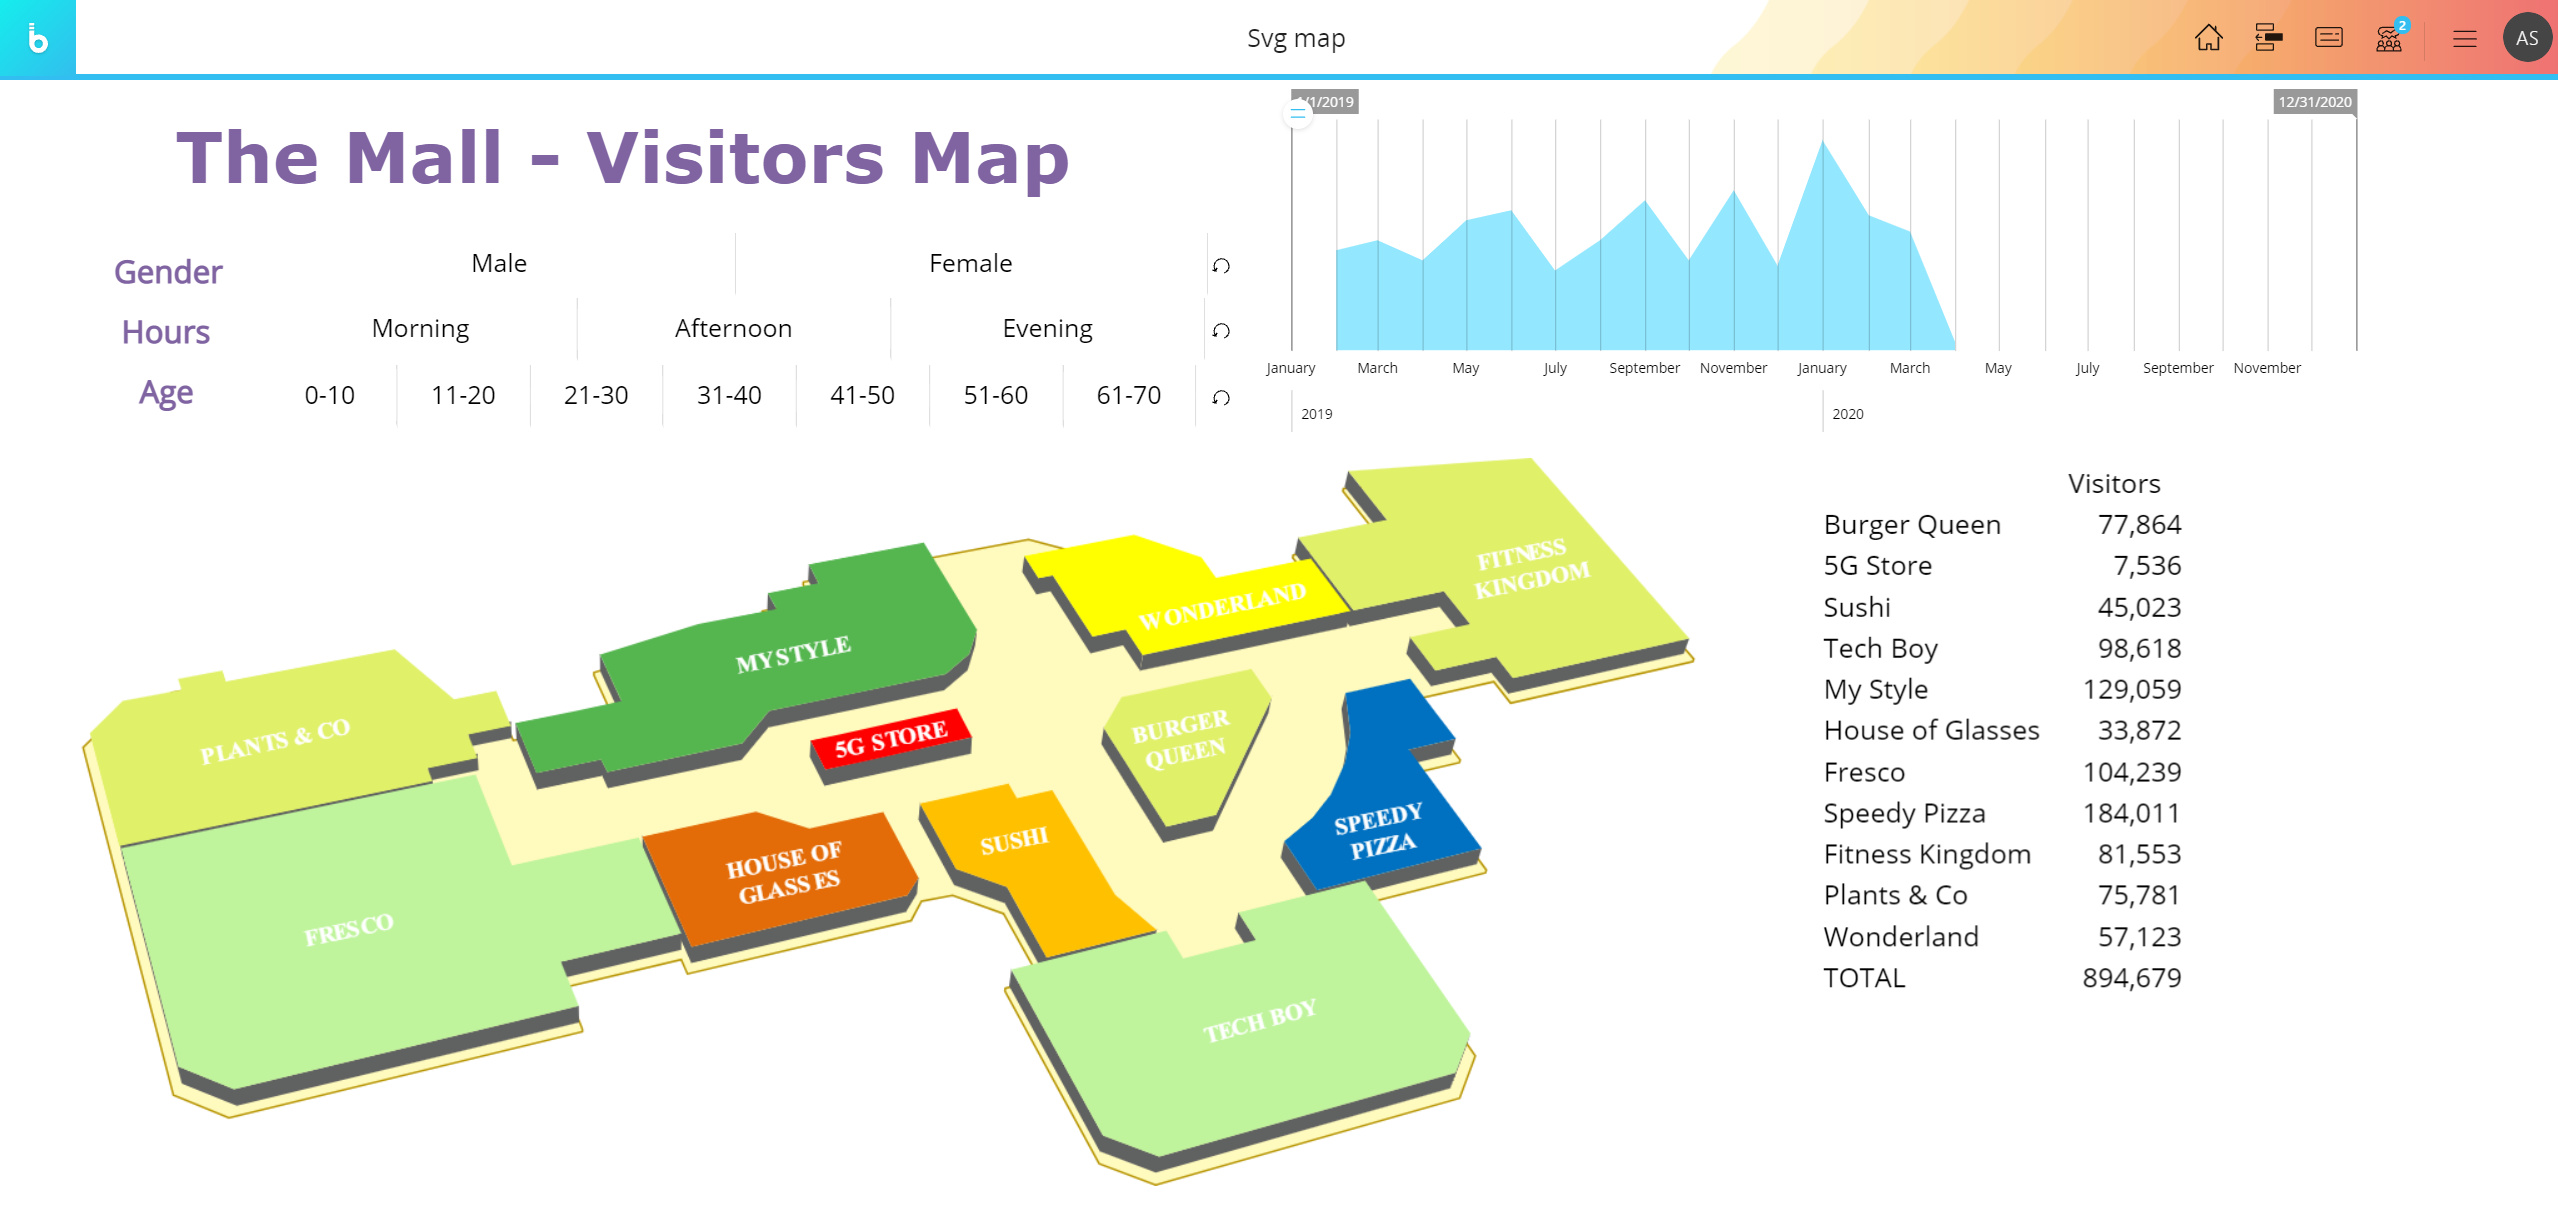
The following picture shows a Svg map with a color alert set on a ranking function that calculates the percentage of visitors for each shop. Based on the ranking function results, the color conditional formatting is then applied to mapped areas (shops).
Learn more about:
- Creating an Svg map Object
- Interacting with Svg map Objects
- The Google Maps Object
- The OpenStreetMap Object