NEXEL (Formula editor)
This topic describes how to use the Nexel calculation layer with Data Views.
Nexel combines the flexibility and the versatility of a spreadsheet-like application with the power and robustness of a multidimensional object as the Data View. It offers a wide library of formulas embedded in the reporting layer to provide additional calculation capabilities on columns, ranges of cells and even single cells.
Once calculation rules have been defined, they are applicable at runtime or in a Procedure action.
Enabling Nexel formulas
Nexel formulas are equations that can perform calculations, return information, manipulate cell content, test conditions, and more. Formulas always starts with an equal sign (=) and are supported by Data Blocks containing:
- A Cube
- An Algorithm
- Entities & Relationships
- An Empty Block
The result of a Nexel formula overlaps any value generated by a Layout definition.
Enabling Nexel formulas from the Layout editor
Under the "Nexel" menu in the Block settings panel it is possible to enable and configure the Nexel layer for the selected Block. When enabled, it is also possible to define how the formula will be propagated to the cells of the Block.
Two options are available:
- Deepest entity formula (default). Each cell of the Block can have a different formula
- Single formula. The formula is the same for all cells of the Block
A third option, Text Cube formula, is available when certain conditions are met. This option allows you to use a Text Cube to write Nexel formulas. Please refer to this paragraph for more details.
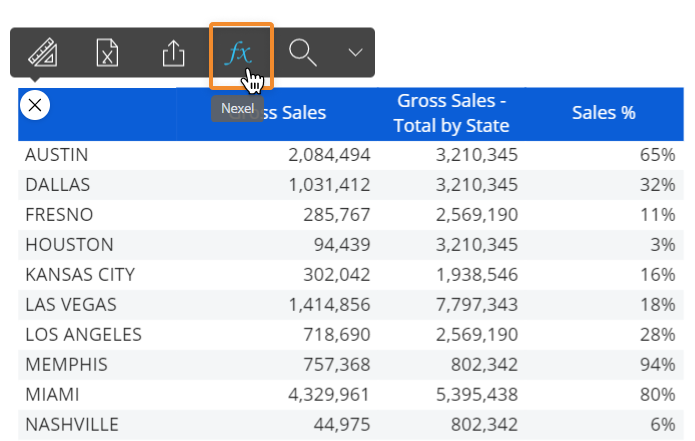
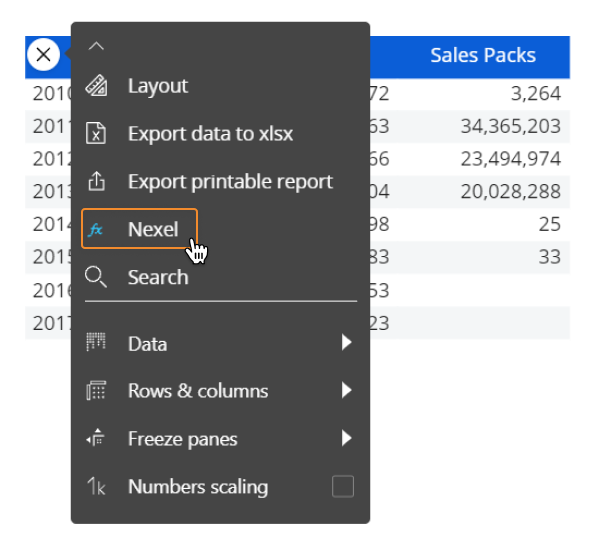
Once enabled, you can access the Nexel configuration page (Formula editor) from the sliding toolbar of the Data View:
Enabling Nexel formulas from the Formula editor
You can enable Nexel on one or more Layout Blocks right from the Formula editor (i.e. the Nexel configuration page). Simply hover over the left side of the Block header to reveal the Nexel "fx" icon: click on it and set the Formula type in the pop up window to enable Nexel.
![]()
Writing Nexel formulas
Nexel Formulas can be created and edited in the Formula editor panel.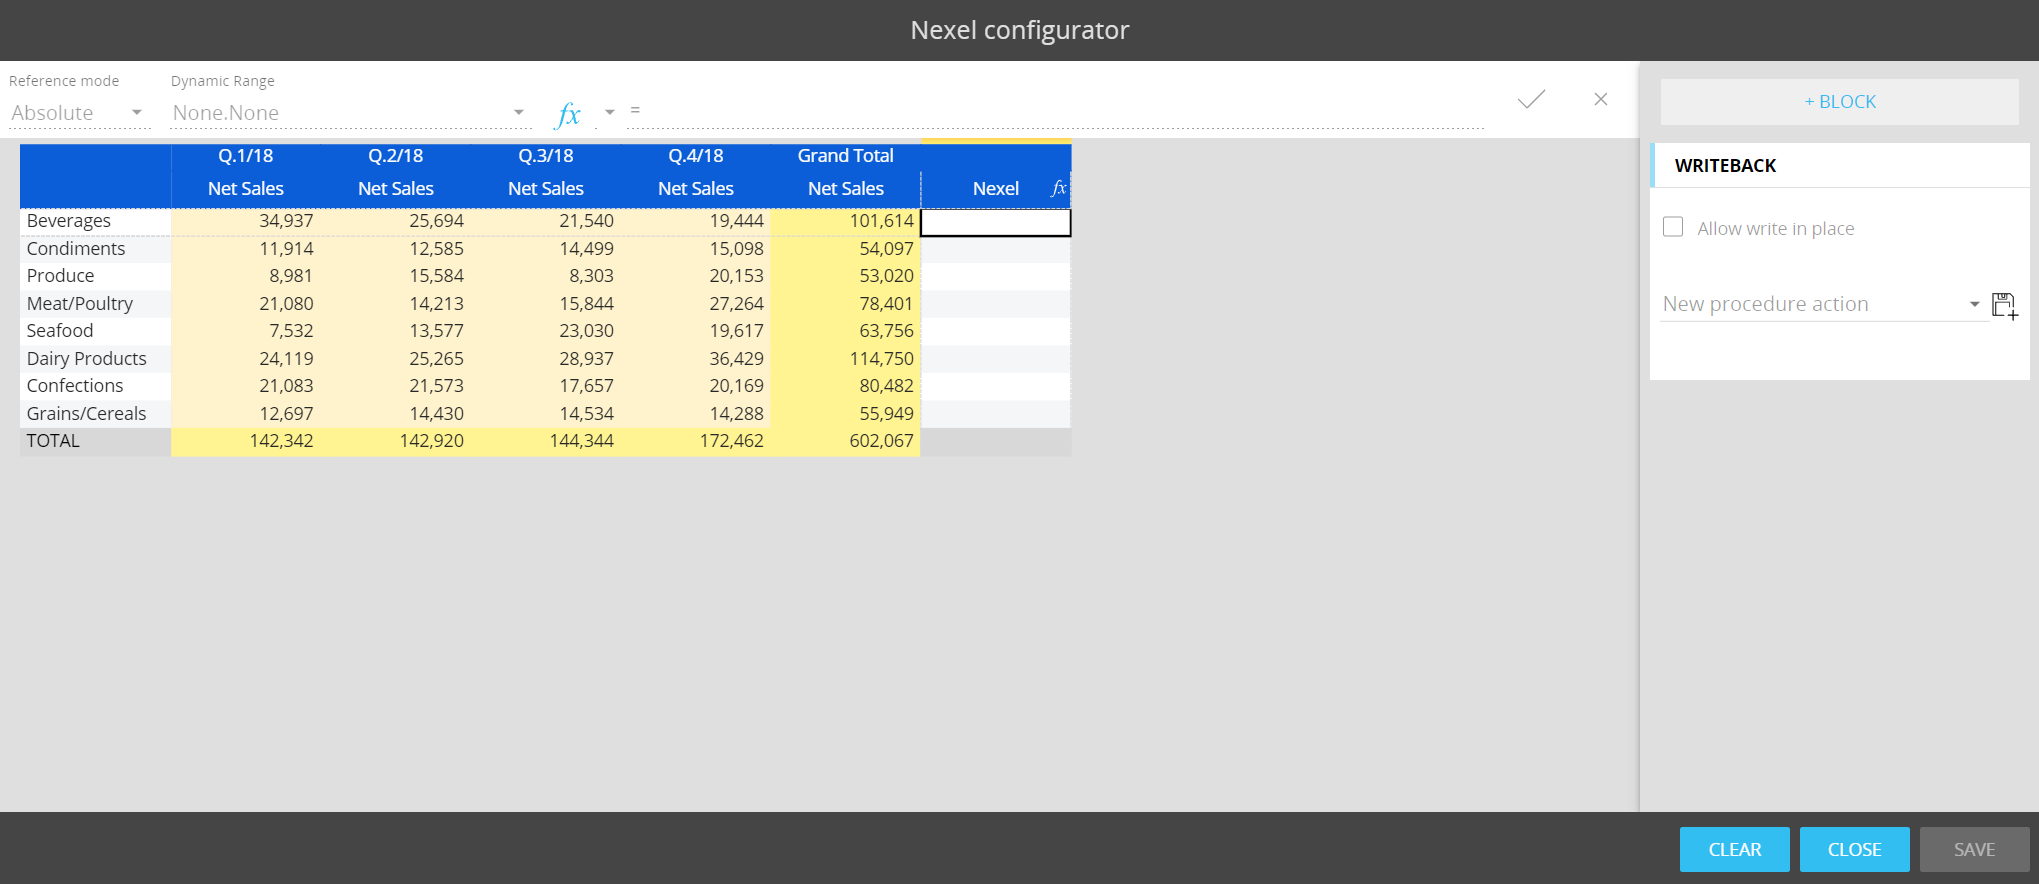
To write a new Nexel formula, proceed as follows:
- Double click on the cell where you want to add the formula: the cell gets highlighted with a black outline and the cursor will move to the fx field on top. It is now possible to enter the formula
- Click the cell (or select a cell range) whose coordinates you want to use in the Formula: selected cells get highlighted with a black outline and the Formula editor automatically adds the corresponding coordinates to the formula
- Select a formula in the dropdown menu right before the formula field or write the formula manually
- Click on the check icon (
 ) to save it in the selected cell. Once saved, you can always edit the formula by double-clicking on the cell that contains it (in the Formula editor panel). The formula result is displayed in the Formula editor preview.
 - Click on SAVE at the bottom right of the panel. The formula result is displayed in your report
The Formula editor shows a preview of the final result of the Nexel Layer. The Nexel Layer configuration is applied to the Layout when you click on SAVE at the bottom right of the panel.
Blocks where Nexel is active show a "fx" icon in column headers: click on it to bring up the Block configuration pop up window.
If a cell contains a formula, a red indicator appears in the corner of the cell. If the Single formula option has been selected, a red indicator appears in the corner of the column header.
When you hover over a cell or header with the red indicator, a tooltip appears showing the formula for a quick reference.
In the Nexel spreadsheet, the first column is A, the second column B, and so on up to Z. Nexel then uses two letters: AA to AZ, BA to BZ, and so forth until ZZ.
Syntax (single cell)
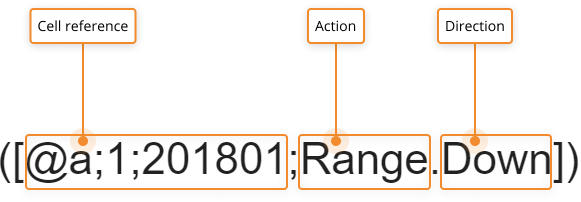
Nexel Formulas that refer to a single cell must be written using the following syntax:
=F(X)([@Block; Row; Column])
| Element | Description | Example |
| F(X) |
Function (optional). Defines what kind of calculation is applied. If omitted, the SUM operator is applied by default. |
SUM |
| @Block |
Block identifier. Identifies the Block in the Layout , preceded by the @ symbol (@a means Block “a"). See About Data Blocks of a Layout for more details. |
@a |
| Row |
Row identifier. The row in the Data View, identified with the Code of the member belonging to the Entity set by row in the Layout. It can be defined via absolute or relative reference, for example S01 (code for Store 01) or * (asterisk) to indicate the same row of the cell that contains the formula |
S01, * |
| Column |
Column identifier. The column in the Data View, identified with the Code of the member belonging to the Entity set by column in the Layout. It can be defined via absolute or relative reference, for example 201901 (code for January 2019) or * (asterisk) to indicate the same column of the cell that contains the formula |
2019, * |
A cell is uniquely identified by the code of the member set by row and/or column even if the report displays the Description of such Item.
Syntax (range)
Nexel Formulas that refer to a cell range must be written using the following syntax:
=F(X)([@Block;Range(cell_1:cell_2)])
| Element | Description | Example |
| F(X) |
Function (optional). Defines what kind of calculation is applied. If omitted, the SUM operator is applied by default. |
SUM |
| @Block |
Block identifier. Identifies the Block in the Layout , preceded by the @ symbol (@a means Block “a"). See About Data Blocks of a Layout for more details. |
@a |
| Range |
Cell range. Cell range defined by the reference of the upper left cell of the range and the reference of the lower right cell of the range. It can be defined via absolute or relative reference, for example 2;201901 (code for member 2 and January 2019) or * (asterisk) to indicate the same row or column of the cell that contains the formula |
2;201901:4:201901 |
Ranges can be defined only on a single Block. They can’t collect cells belonging to different Blocks.
You can include one or more Data Pickers in Nexel Formulas.
The complete description of all supported functions is available in the Nexel Complete Function Library file (2,6 Mb, PDF).
Reference Mode
The Formula editor is able to identify cells using two reference modes:
- Absolute. The cell is identified by its coordinates (Row and Column, defined by the Code of the member belonging to the Entity set by row and column in the Layout)
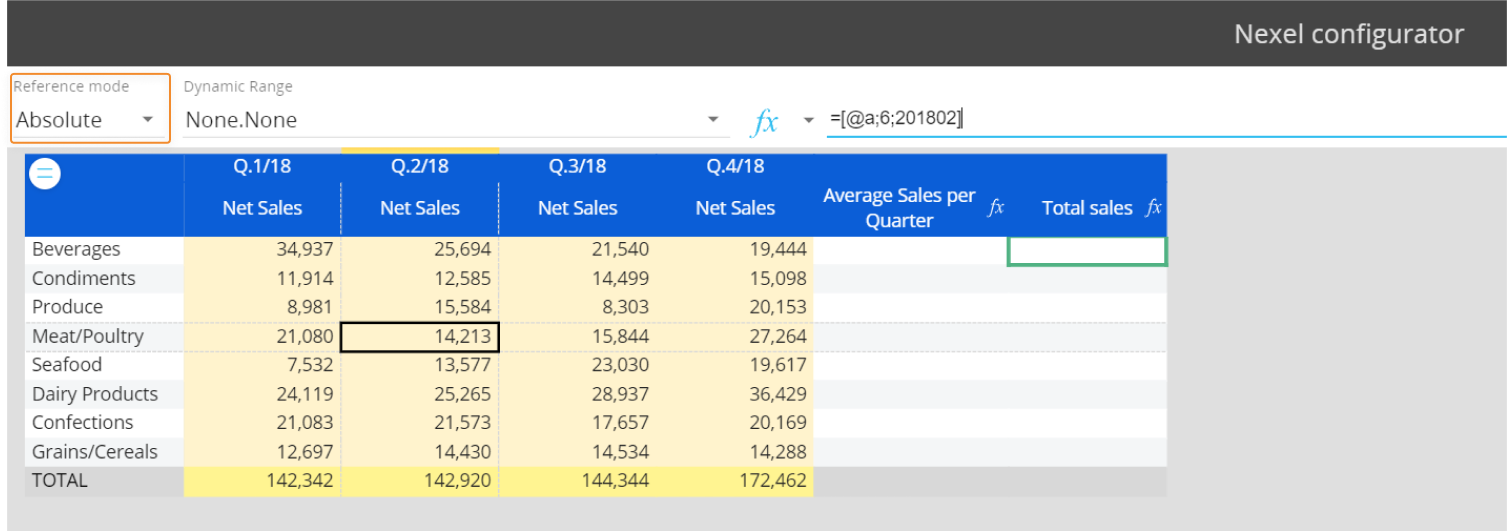
The cell in the formula is identified by the coordinates [@a;6;201802] where "@a" is the Block identifier, "6" is the code for the member "Meat/Poultry" (Entity set by row), and "201802" is the code for Q.2/2018 (Time Entity set by column). - Relative. The cell is identified by its shift from the position of the cell that contains the formula.
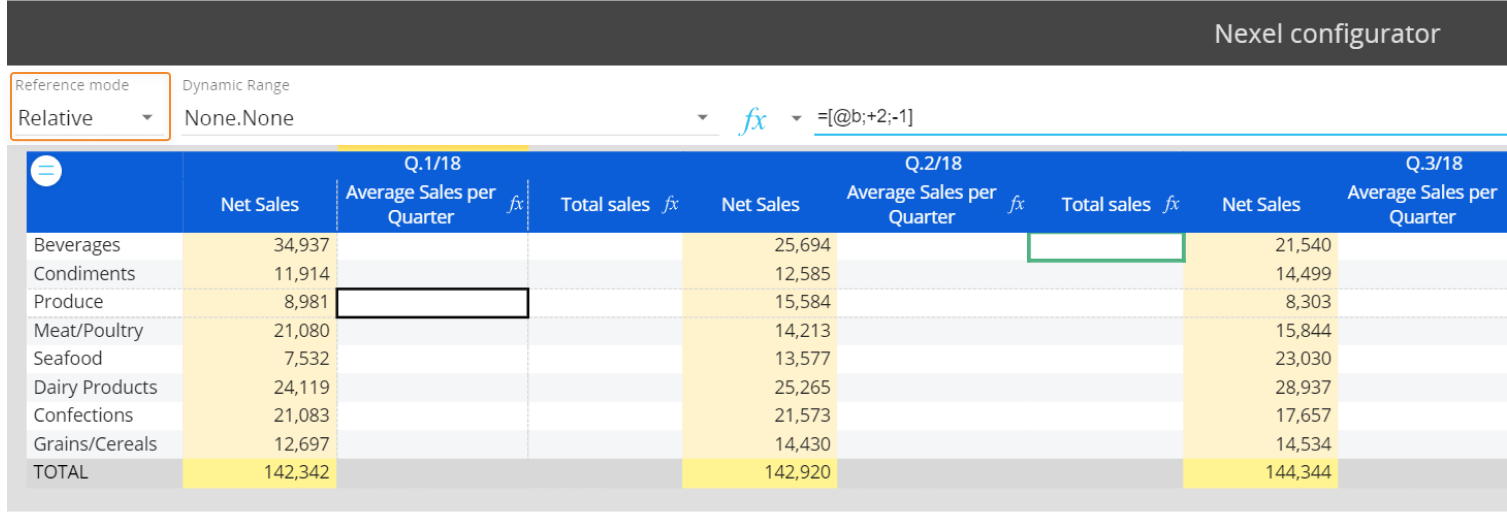
The cell in the formula is identified by the coordinates [@b;+2;-1] where "@b" is the Block identifier, "+2" indicates two rows below the row of the cell that contains the formula, and "-1" indicates one column before the column of the cell that contains the formula .For the relative reference to work correctly, all blocks included in the Data View must have the same number of visible cells. Otherwise, you can use the Dynamic Range option to partially overcome this limitation (see next paragraph for more details).
Nexel formulas are considered after the Layout and before client-side actions. If you set up an algorithm Block that relies on another Block containing a Nexel formula, then the calculation happens before the Nexel one and the result might be incorrect.
If you set up a Block containing a Nexel formula with a relative reference in it, sorting Blocks won't affect the calculation because the sorting is applied after the calculation has been performed.
Cells identified in a formula depend on the position of the cell that contains the formula.
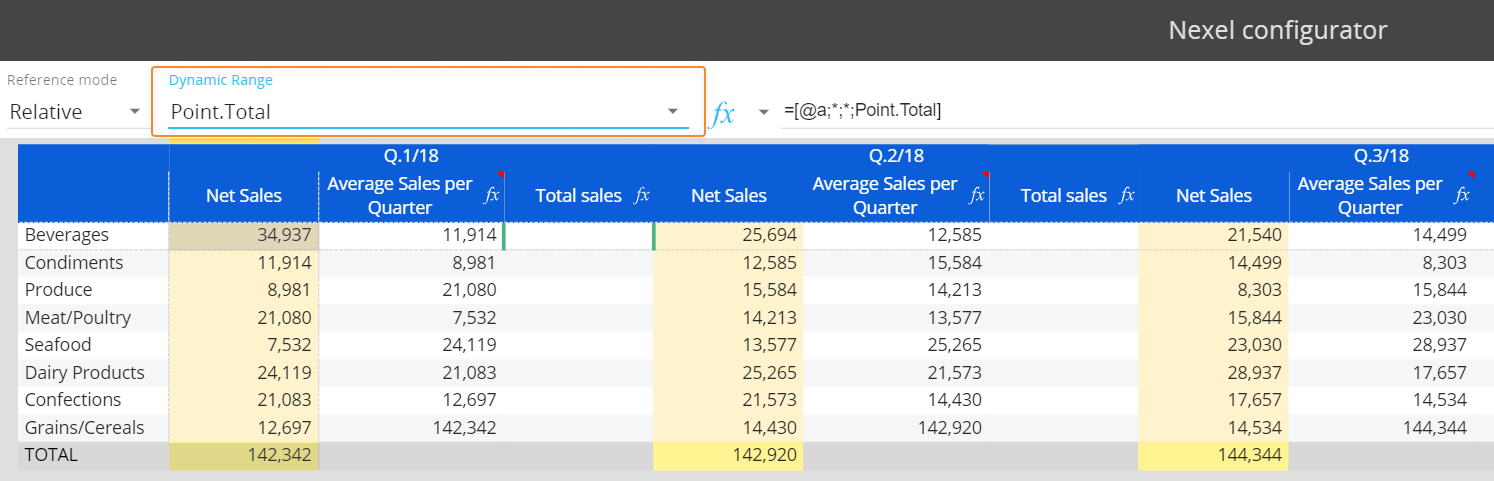
Dynamic Ranges
Dynamic Ranges allow the selection of large sets of cells as function inputs and overcome limitations such as when Blocks have a different number of visible cells in the Data View.
Some Functions, such as the Average function, should only apply to a Range of cells, otherwise they would be meaningless.
The Dynamic Range dropdown menu at the top of the page helps you choose the best Range setting for your formula.
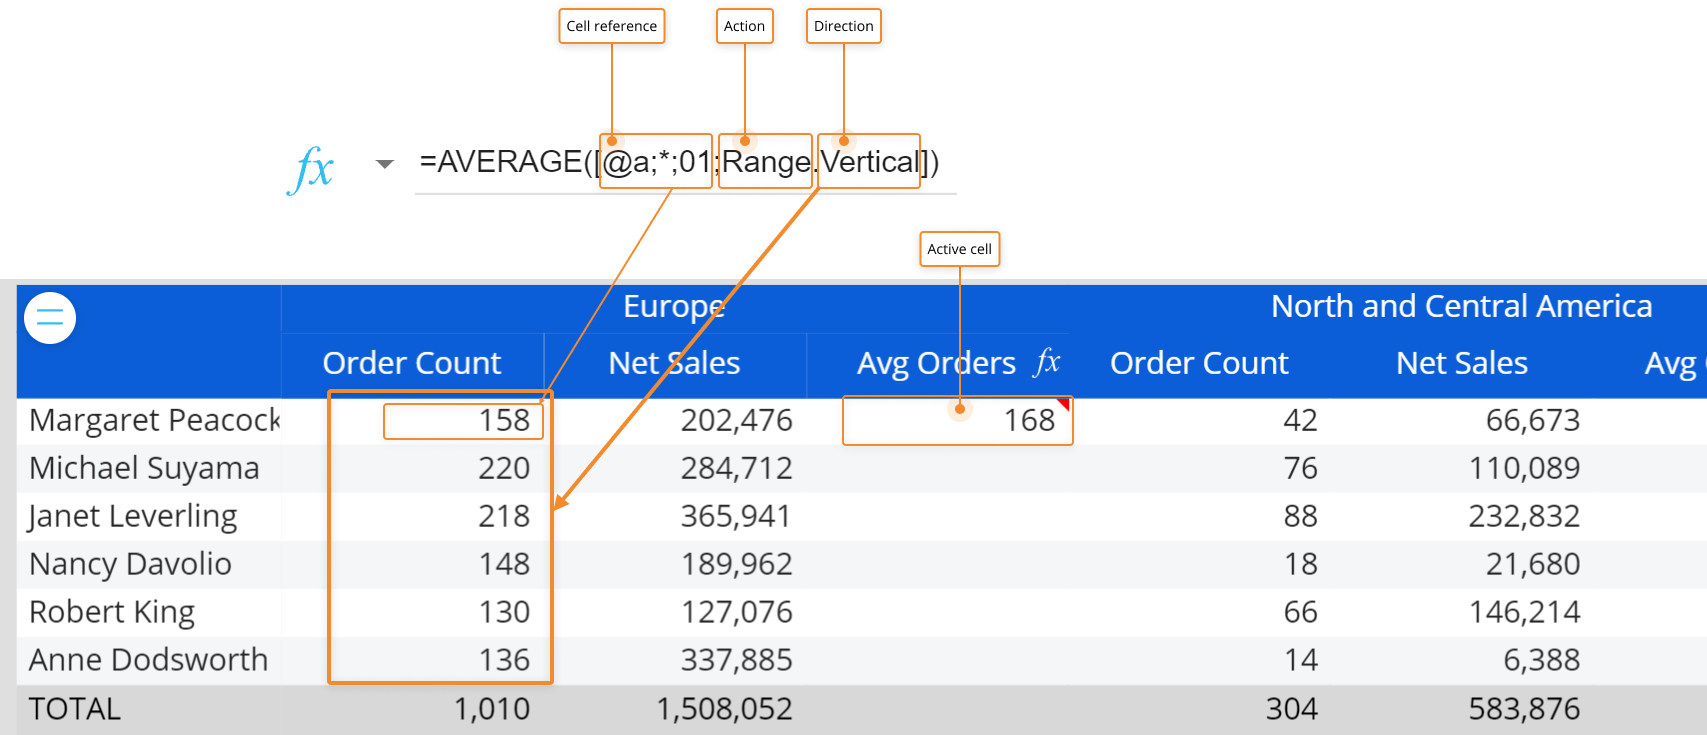
The Dynamic Range syntax supports two attributes: action and direction.
The action attribute can be one of the following:
| Action | Description |
| None | No action is taken |
| Range | Selects all cells in the selected Range |
| Count | Counts all cells in the selected Range |
| CountEx | Counts all cells with non-zero values in the selected Range |
| Point | Selects a single cell depending on the position of the active cell |
An action can be combined with the direction attribute. It can be one of the following:
| Direction | Description |
| Whole | Considers the entire range of cells |
| Up | Considers all cells above the referenced cell, including it |
| Down | Considers all cells below the referenced cell, including it |
| Left | Considers all cells on the left of the referenced cell, including it |
| Right | Considers all cells on the right of the referenced cell, including it |
| Vertical | Considers all cells in the column of the referenced cell |
| Horizontal | Considers all cells in the row of the referenced cell |
| Total | Considers the Down Total cell in the column of the of the referenced cell |
When using Dynamic Ranges, cells identified in a formula depend on the position of the cell that contains the formula and on the direction attribute.
Nexel behavior with other Objects and features
Select/Pagers/Selectors
Nexel formulas can refer to a single cell or cell ranges and all these cells must be displayed in the Data View. That's why a formula cannot refer to cells that are out of the current Selection.
You can use Filters to hide rows, but the hidden cells are still considered in the execution of the Formula. We recommend that you preview Nexel results with the Hide Zeroes option turned off in the Layout editor for better troubleshooting.
Drill Down
Drilling down is allowed only for "Single formula" configurations: in those scenarios the Nexel level is also applied to the drilled report, but it can't be modified at that level.
If there are one or more "Deeper Entities" configurations in the Data View, the Drill down option is automatically disabled.
Format & Color alerts
Block Format option can also be applied to Blocks containing Nexel formulas.
If a Color Alert is set up on a Block where data and Nexel Formula calculations coexist, the results of the Nexel formulas will determine the behavior of the alert and not the underlying values.
Layout Alignment
Nexel is not supported when the Blocks alignment option is set to "Vertically" under the Object properties settings in the Layout editor.
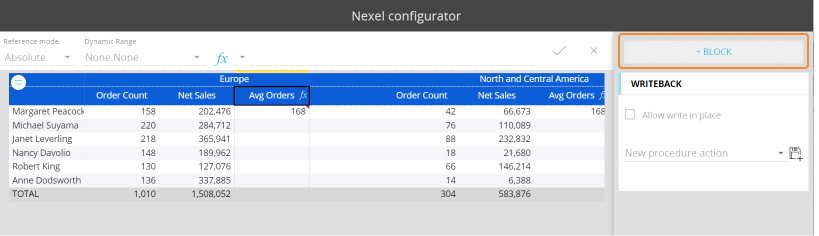
Add a new Block
From the Formula editor you can add a Block to the Layout on the fly: simply click on the +BLOCK button in the top right corner of the page. The new Block is an algorithm one with Nexel already enabled on it.
From the configuration pop up window you can define:
- The Block heading
- How the formula will be propagated to the cells of the Block (Formula type)
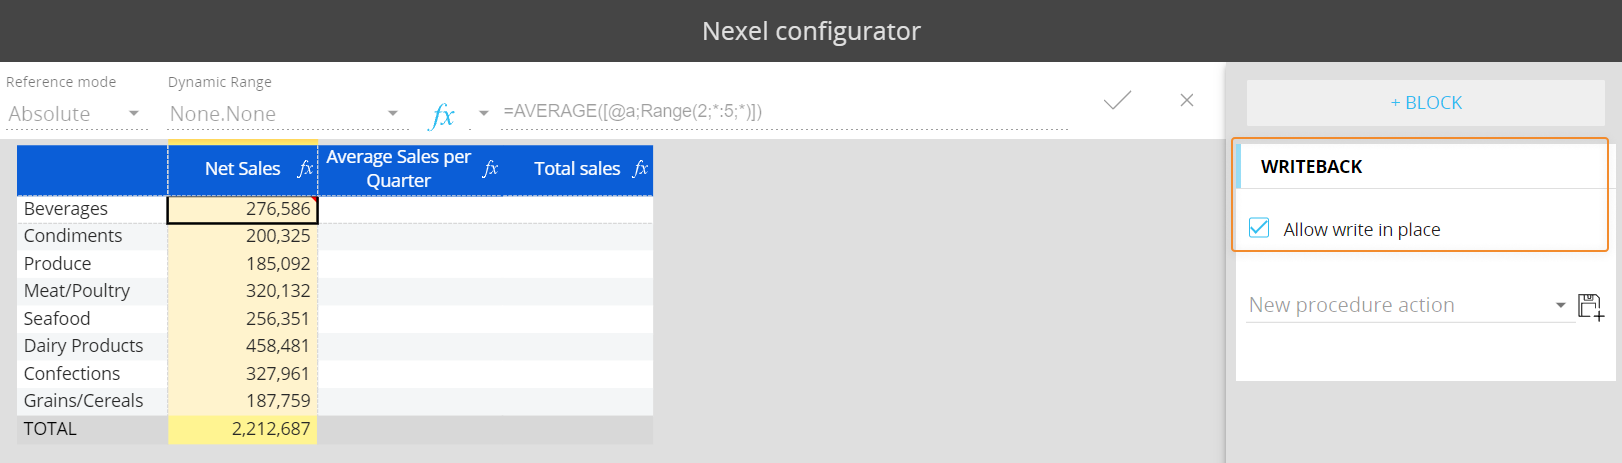
Allow Write in place
You can save results of Nexel formulas into Cubes just like you would with data entry actions.
To do this, the following conditions must be met:
- Nexel formulas must be created on a Cube type Block
- Data entry must be active on the Block
- The Allow Write in place flag must be checked in the Nexel Formula editor
In this case, the result of the formula is saved as soon as the calculation is performed.
Procedure Action Library
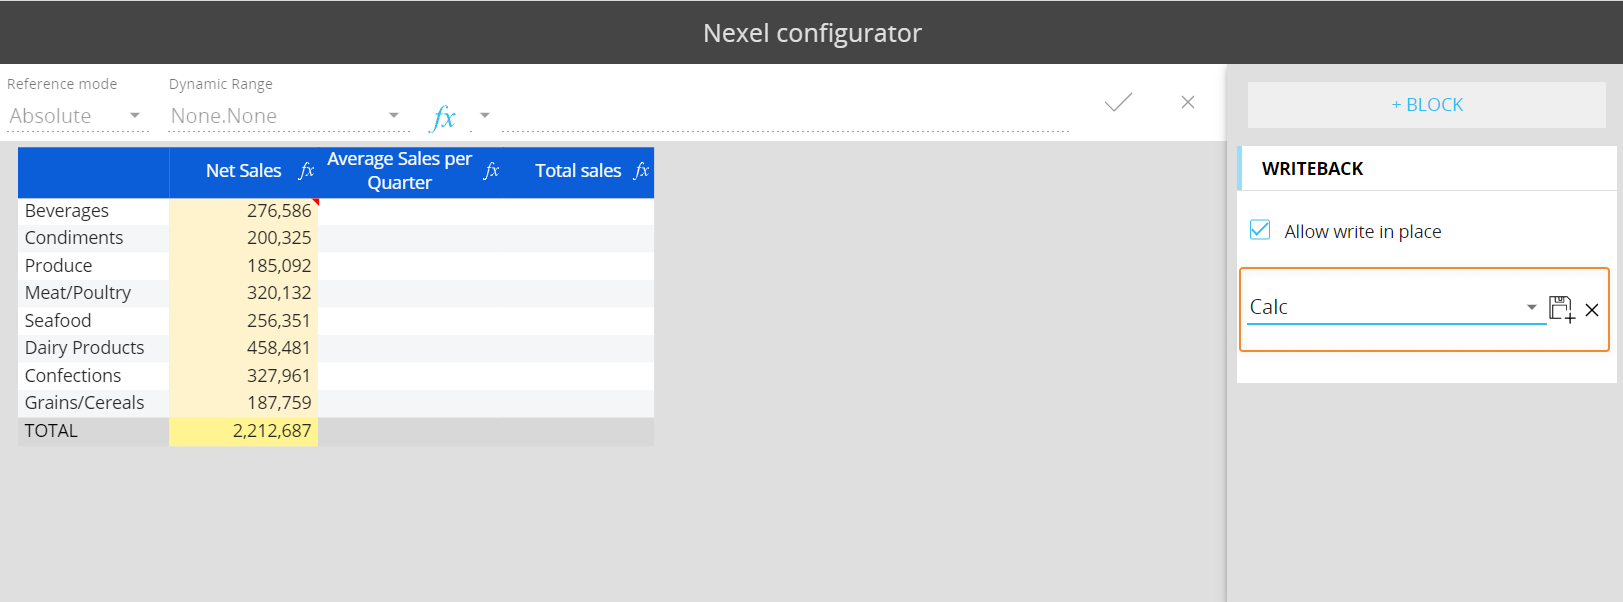
You can save your current Nexel spreadsheet as an element of the Action Library.
The Action Library is a group of actions specific to each Board Data model. Such elements can be used in Capsule Procedures and/or in Database Procedures.
Actions saved in the Action Library of a Data model cannot be copied or transferred to another Data model.
To add a Nexel spreadsheet to the Action Library, click on the floppy disk icon and enter a name for the new action. Click on SAVE at the bottom right of the Formula editor page.
The new Action is available under "Nexel writeback" in the Calculation actions group in the Procedure configuration page (Procedure designer).
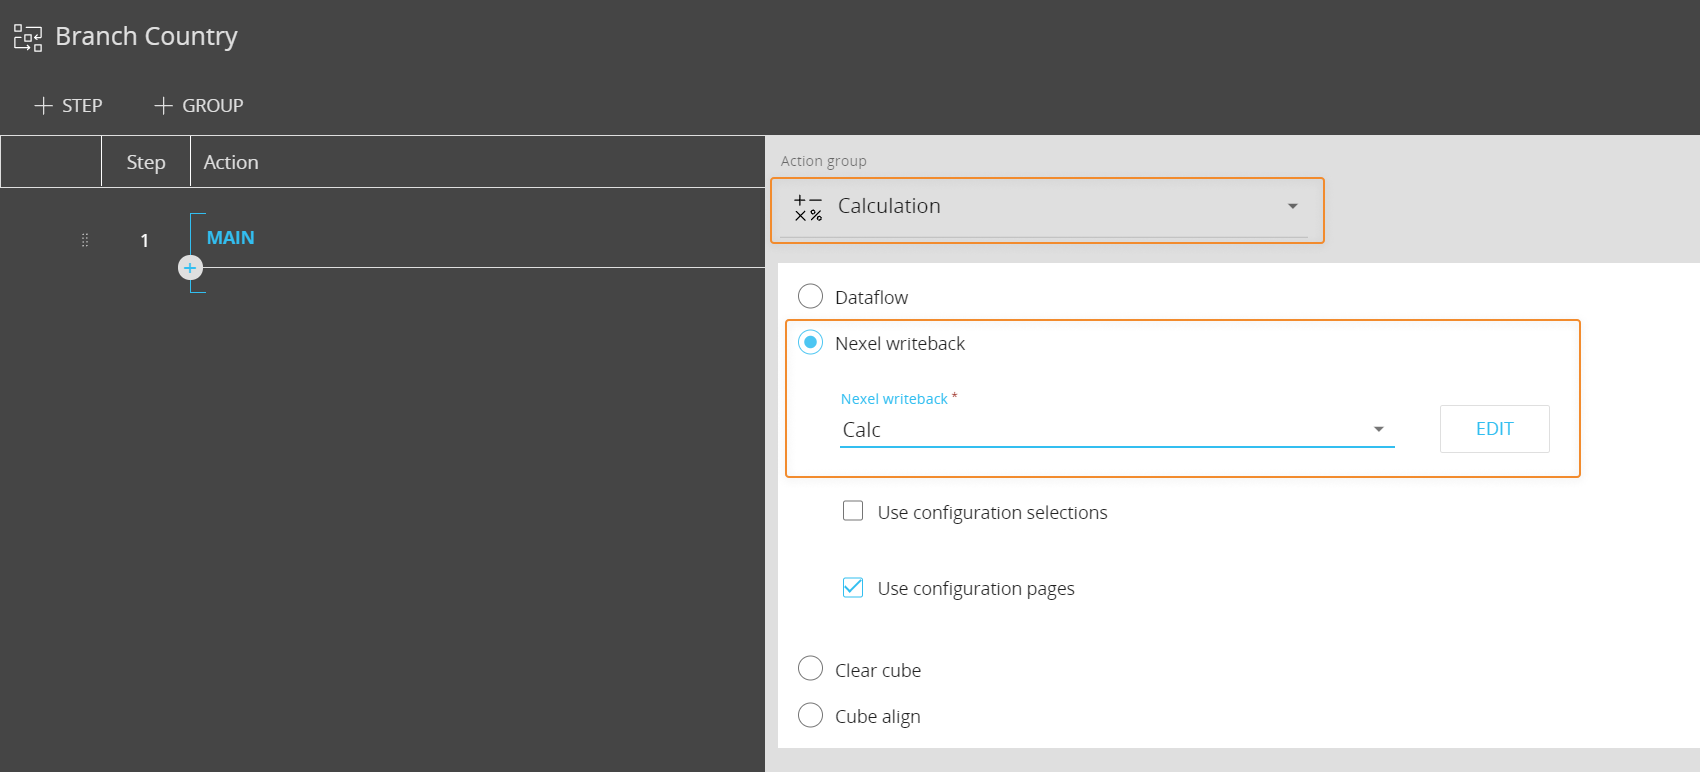
The Nexel writeback Action saves data in Data entry mode, paging through all dimensions of the target Cube that are not included in the Layout axes. The logics of a Procedure Action are closer to a recurrent data entry action than to a Dataflow, therefore the Procedure Action could be much faster.
A Nexel writeback action is able to write data only at the physical level of a Cube.
To use a saved Nexel writeback action in a Procedure, select it and check the "Use configuration selections" checkbox if you want it to use the Selections and/or Pagers that were active when the Nexel formulas have been saved. If the "Use configuration selections" flag isn't checked, the Nexel writeback action will inherit the Procedure Selections.
The "Use configuration pages" option is currently deprecated but is still available for backward compatibility purposes. The option is active by default and we recommend to leave it enabled to ensure that the calculations are performed correctly.
The Edit button opens the Nexel Action in the Formula editor, in case you want to edit existing formulas on the fly.
How to use Nexel to manage Relationships
You can use Nexel to manage Relationships between two Entities based on the result of a Formula. This allows to dynamically change Relationships between two Entities when certain conditions change.
For example, let's say you want to aggregate Customers into the following categories based on the value of their sales:
- "High" for customers whose sales value is above the average of the total sales
- "Low" for customers whose sales value is below the average of the total sales
To do this, configure a layout with the Gross Sales Cube as the driver and the Customer Category Cube with Data entry enabled.
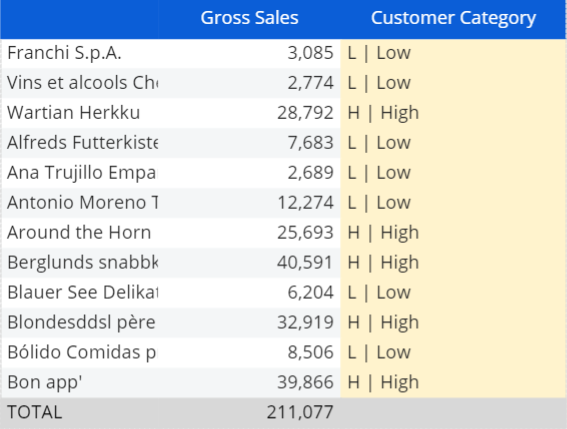
In the Formula editor, add the calculation for the average of the total sales and compare its results with the Customer sales value. The result of the comparison formula can be "H" (High) or "L" (Low) and, for each customer, it will be written in the Customer Category Cube..
The Formula you need is the following:
=if([@a;*;*]>AVERAGE([@a;*;*;Range.Vertical]);"H | High";"L | Low")
The result of that formula would be:
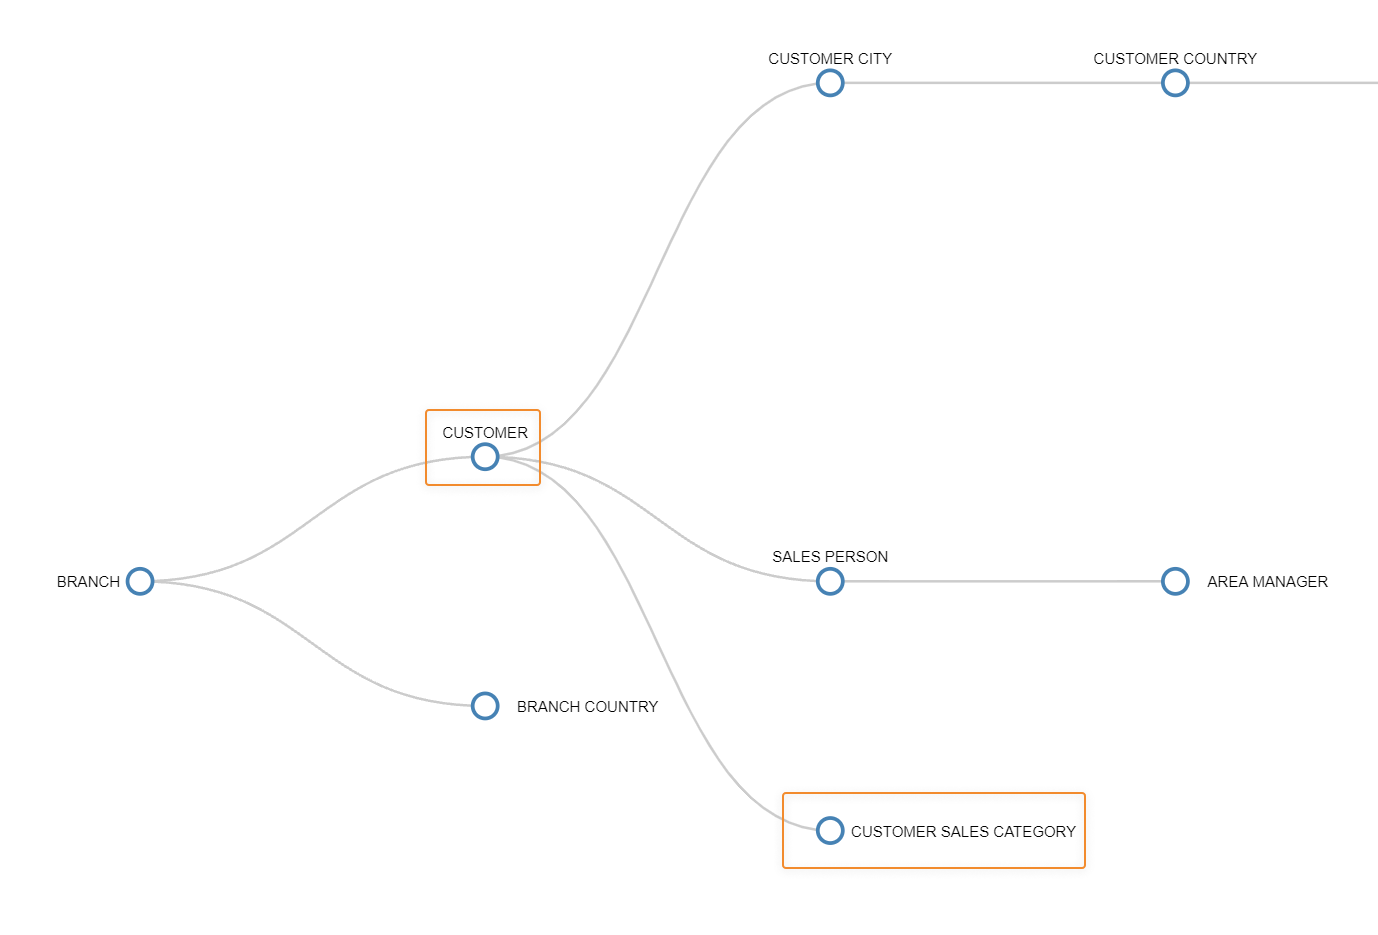
The following tree shows the Relationship between the Customer Sales Category Entity and the Customer Entity:
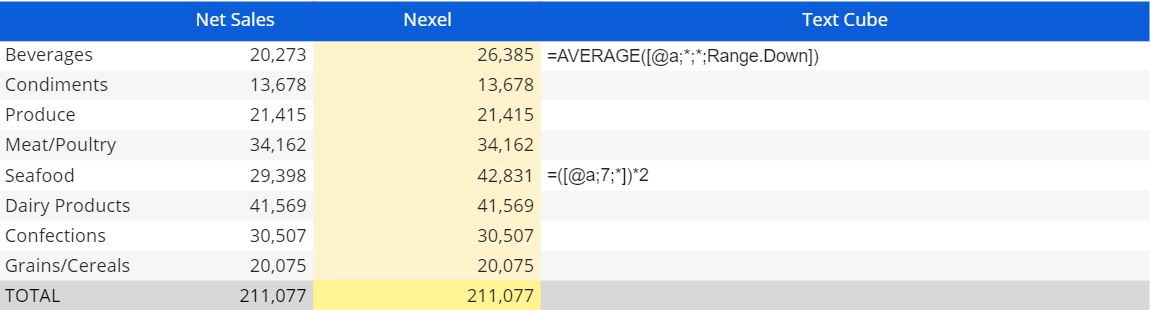
How to use Text Cubes to write Nexel formulas
Text Cubes can be used to edit Nexel Formulas. This is particularly useful for creating prepackaged Formula schemas that can be easily reused in different Nexel sheets.
The following conditions must be met:
- The Layout must have a Text Cube in Block (it can be hidden)
The Text Cube must have dimensions consistent with the layout structure (rows and columns)
- In the Block settings panel for the Block with data (Cube Block), under the Nexel menu the Formula type option must be "Text Cube formula" and the text Cube that contains formulas must be selected in the "Formulas in" dropdown menu.
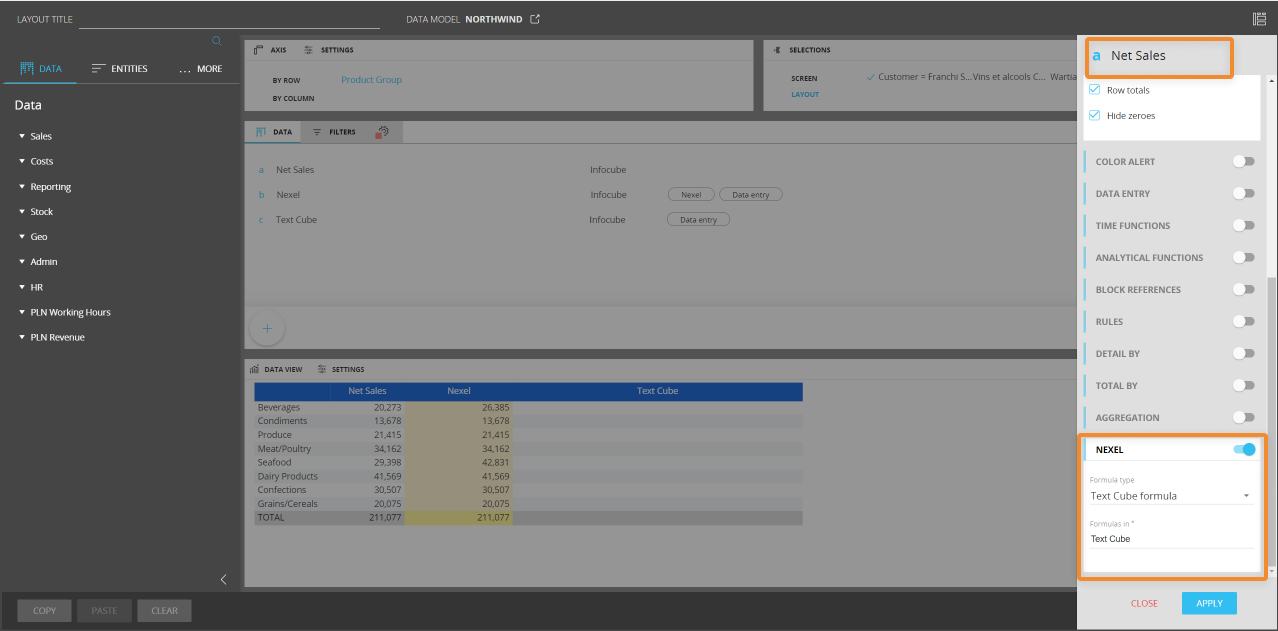
And here's the result in the Data View:
CrossView
The Nexel CrossView feature allows you to collect data from multiple Data Views inside a Screen. It is a very advanced feature and it's particularly useful for summarizing data from several Data Views into one.
To activate CrossView, just change the usual Nexel syntax by adding a Data View identifier as the first argument of the function:
=F(X)([#Dataview;@Block; Row; Column])
The #DataView argument is the Layout title of the referenced Data View.
When you activate the CrossView feature, Nexel will look for the cell reference in the specified Data View: for example, if you reference the third row of a Data View in the function, Nexel will move in the third row of the referenced Data View to apply ranges and formulas.
If a cell reference does not exist in the referenced Data View, no value will be returned.
Example:
Let’s suppose you have a Data View with sales data dimensioned by month and another Data View with quantity sold dimensioned by product and you want to calculate a Summary Data View.
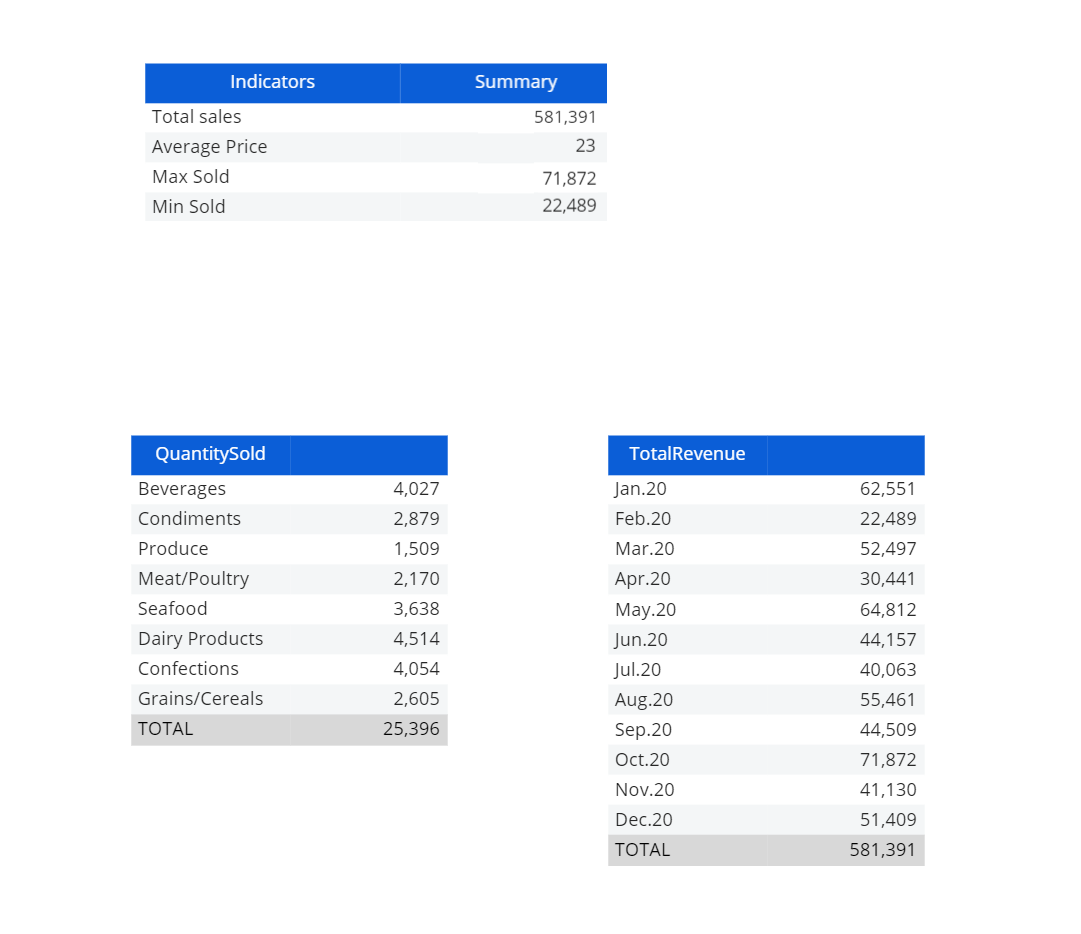
To calculate the summary Data View on top, we used the following Nexel formulas with the CrossView feature:
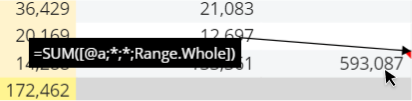
- For the "Total sales" row → =SUM([#TotalRevenue;@a;*;Range.Vertical])
- For the "Average Price" row → =SUM([#TotalRevenue;@a;*;Range.Vertical])/SUM([#QuantitySold;@a;*;Range.Vertical])
- For the "Max Sold" row → =MAX([#TotalRevenue;@a;*;Range.Vertical])
- For the "Min Sold" row → =MIN([#TotalRevenue;@a;*;Range.Vertical])
As you can see, we took the total value of the two Data Views to calculate the Average price, while we used the TotalRevenue Data View to calculate the other indicators with various formulas (MAX, MIN, SUM).
The Screen must be saved before using the CrossView feature.
Learn more about: