Creating a Data View
This topic describes how to add a new Data View Object to a Screen or a Container and its specific properties.
To create a new Data View, you need to access a Screen in Design mode.
Once you're in the Screen editing page, locate the Data View from the Screen Objects list in the left panel, then drag and drop it onto your Screen or Container.
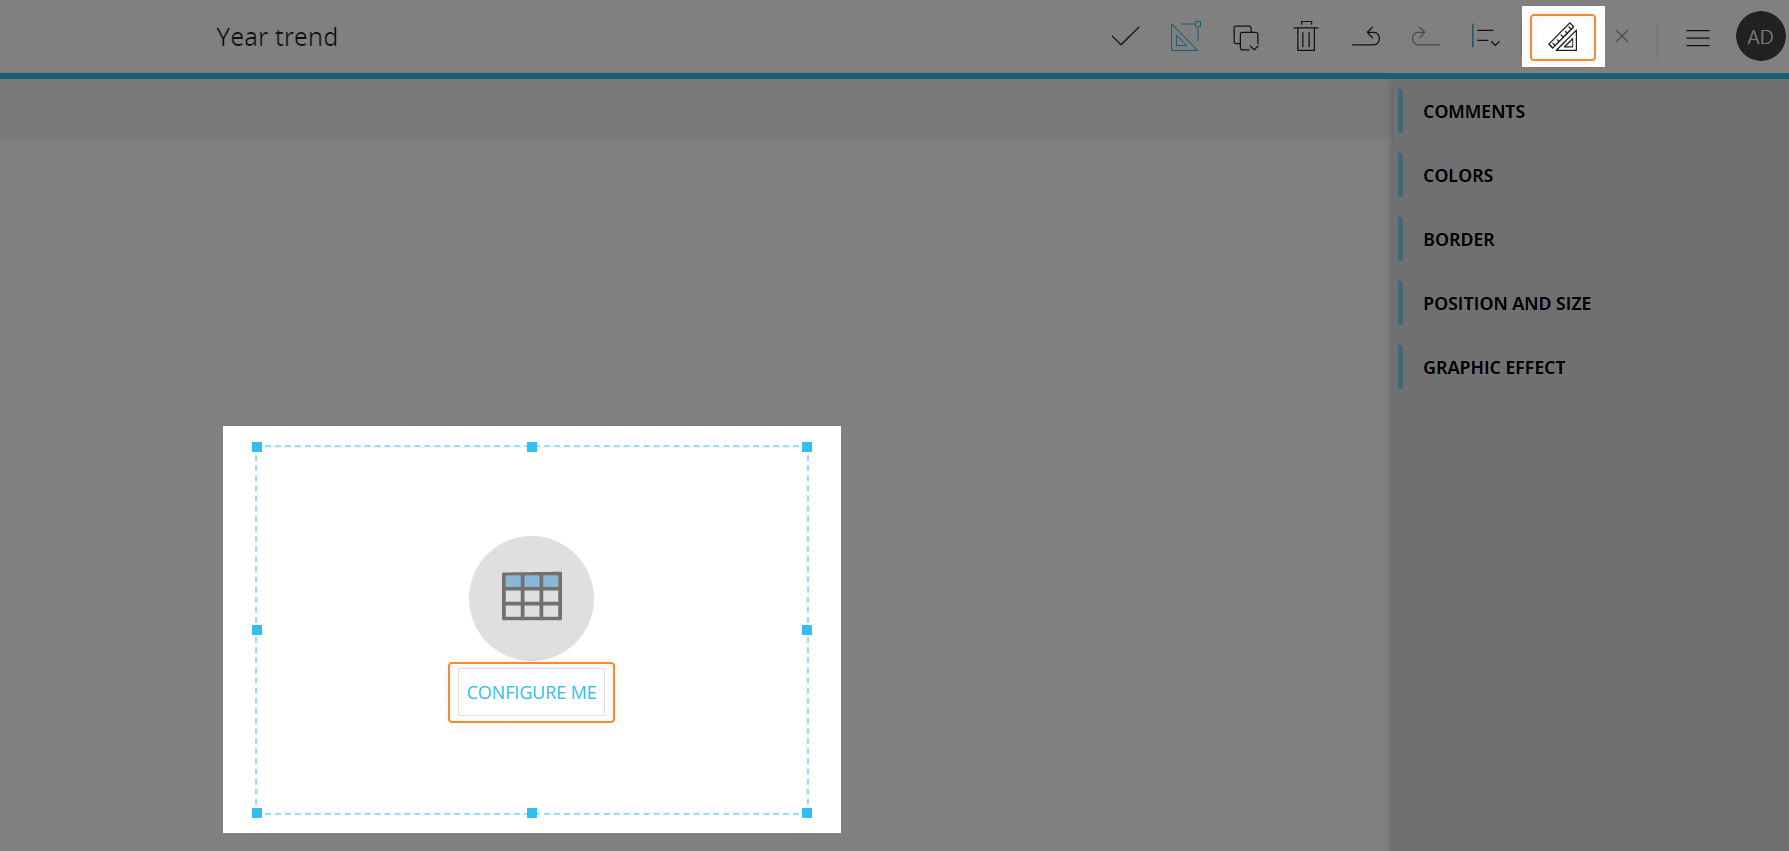
When you create a Data View, it is initially empty. The next step is to configure a Layout that will define the data to be displayed in the Data View. To do so, click the "Configure me" button or select the Data View and click the "Configure layout" button (![]() ) located in the Top Menu of the Capsules workspace.
) located in the Top Menu of the Capsules workspace.
See The Layout Object, Configure a Layout and About data blocks of a Layout for more details on the Layout Object.
The Data View, just like every other Object, can be moved, resized, duplicated via copy/paste and easily aligned with other Objects on the Screen.
See Configure Screen Objects for more details.
Data View Layout
The Layout editor for the Data View Object offers all possible features for configuration, as the Layout Object has been created and developed specifically for the Data View.
See The Layout Object, Configure a Layout and About data blocks of a Layout for more details on the Layout Object.
Axis area
The Data View Object supports as many Entity By Row and by Column as desired.
Please bear in mind that adding a large number of Entities to the Axis area will greatly increase the number of returned values: as a result, the loading time of the Data View may slow down considerably.
When you add multiple Entities by row, Board automatically detects the grouping: the most nested Entity in a Relationship is arranged in the rightmost position in the "BY ROW" field.
You can rearrange the Entities order in each of the two fields only if those Entities are unrelated. To do so, drag and drop them in the desired position.
The Data Area
The Data Area of a Data View Object Layout supports all kinds of Data Blocks (Cubes, Algorithms, Entities, etc.) and all Data Blocks settings.
The maximum number of Data blocks you can add to a Layout is 169.
The Object preview pane
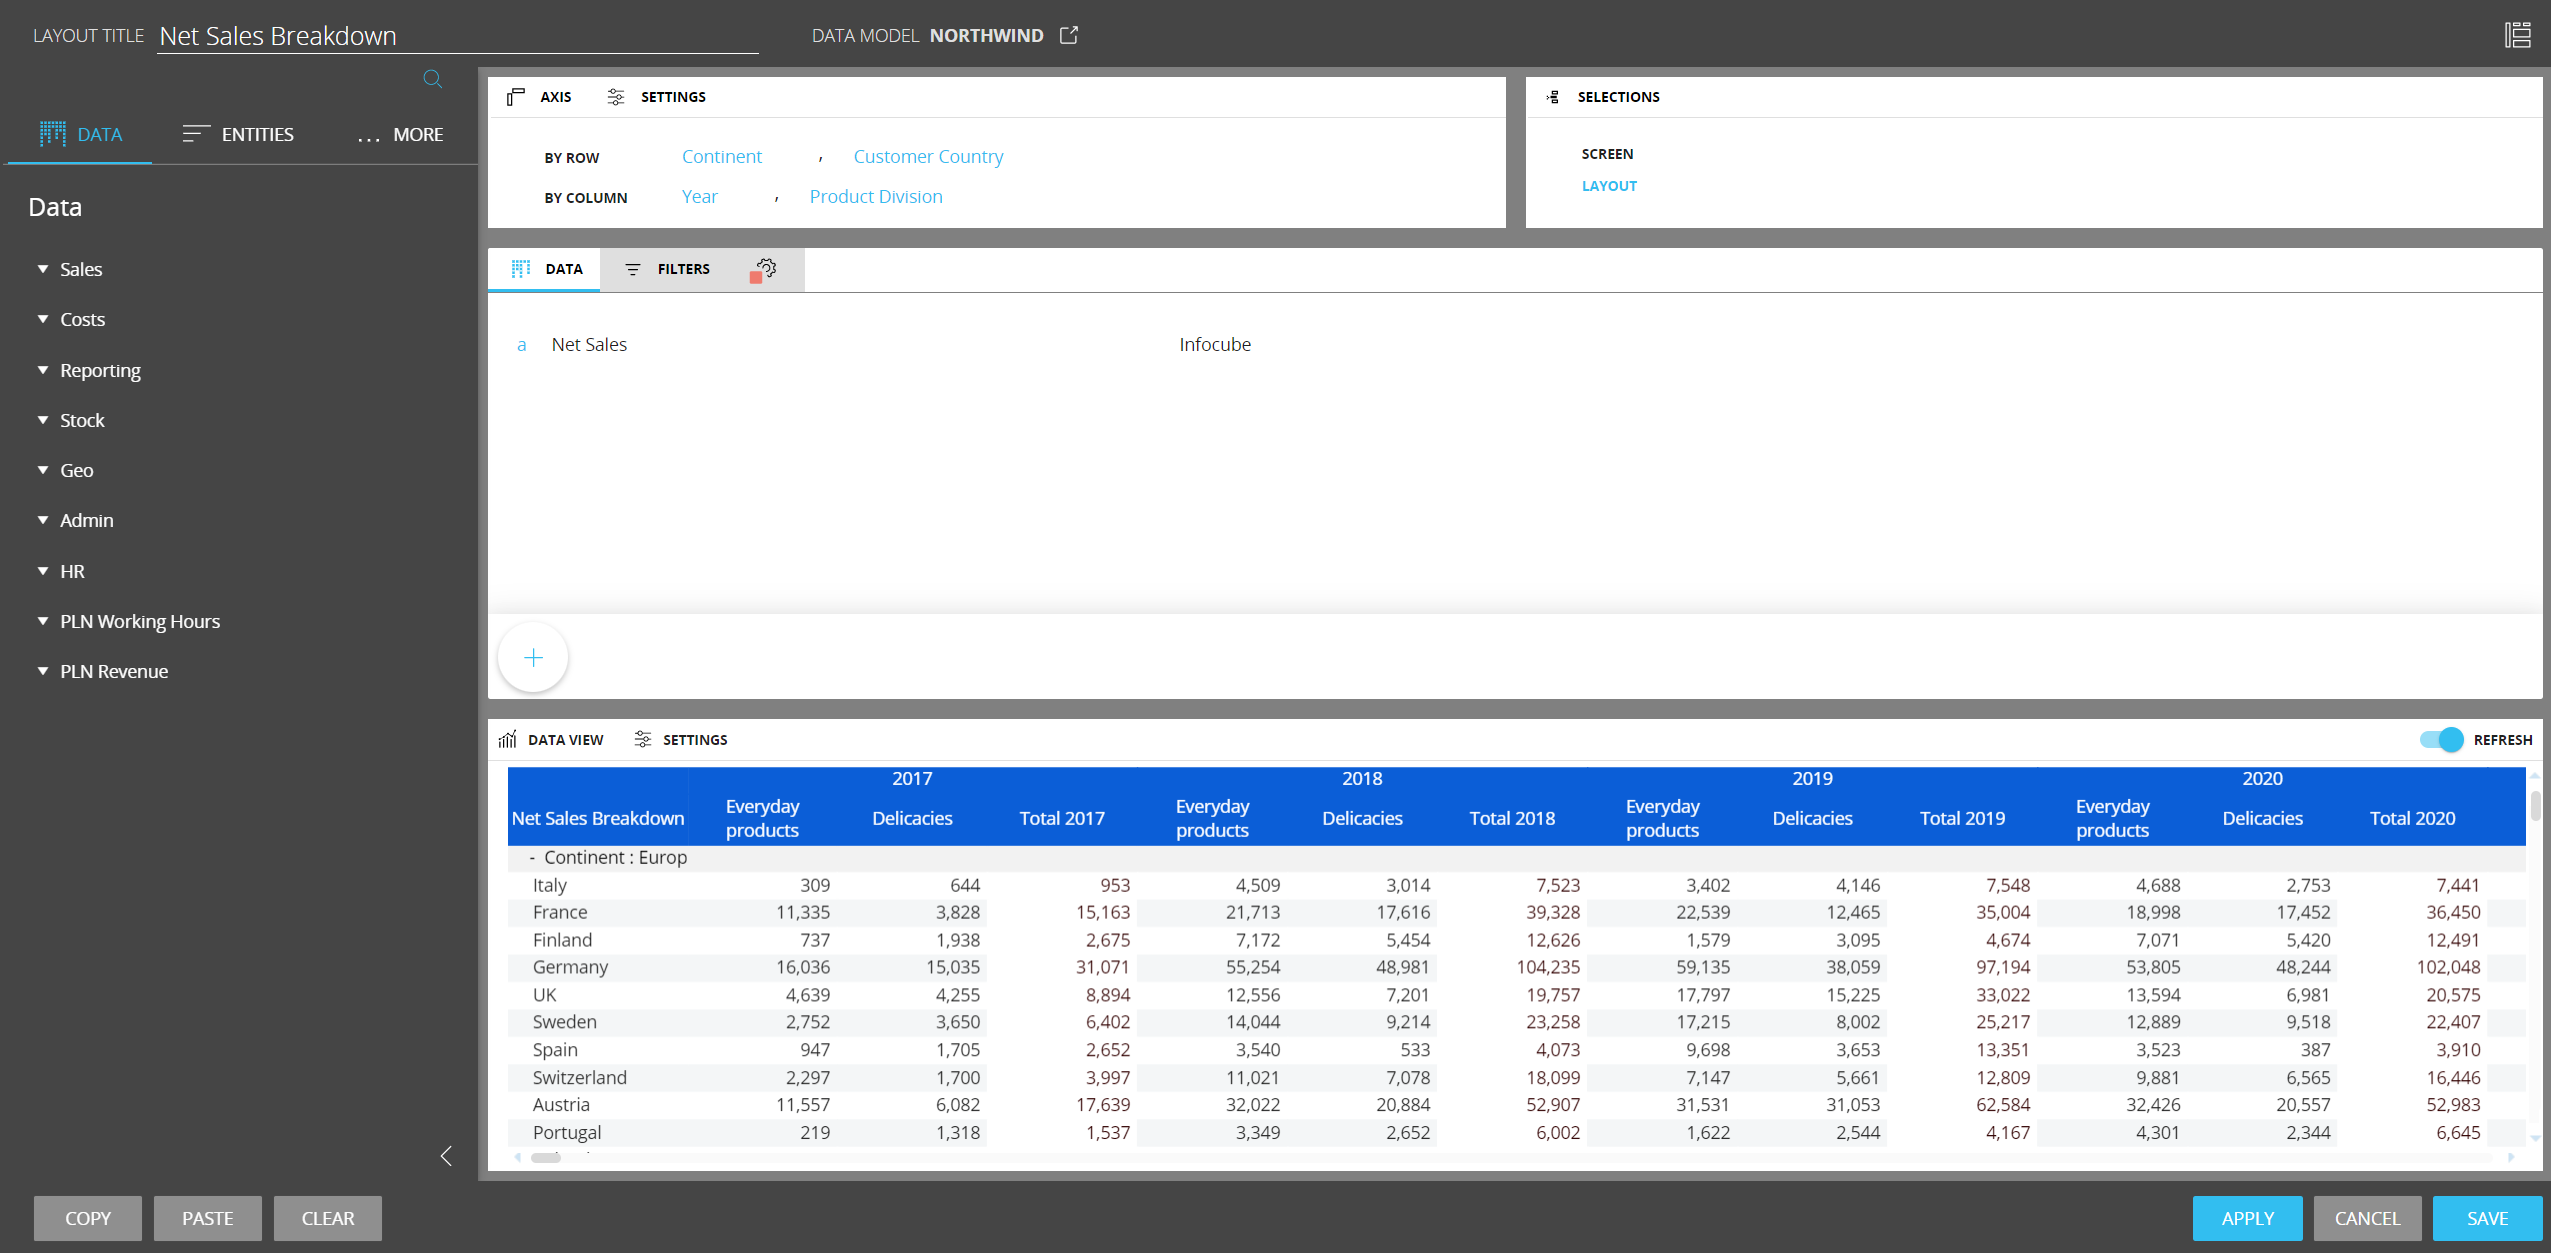
By default, each Block set in the Data Area is displayed as a column of the Data View in the Object preview pane. The column is displayed for all Entities set by Column in the Axis area, as shown in the following image.
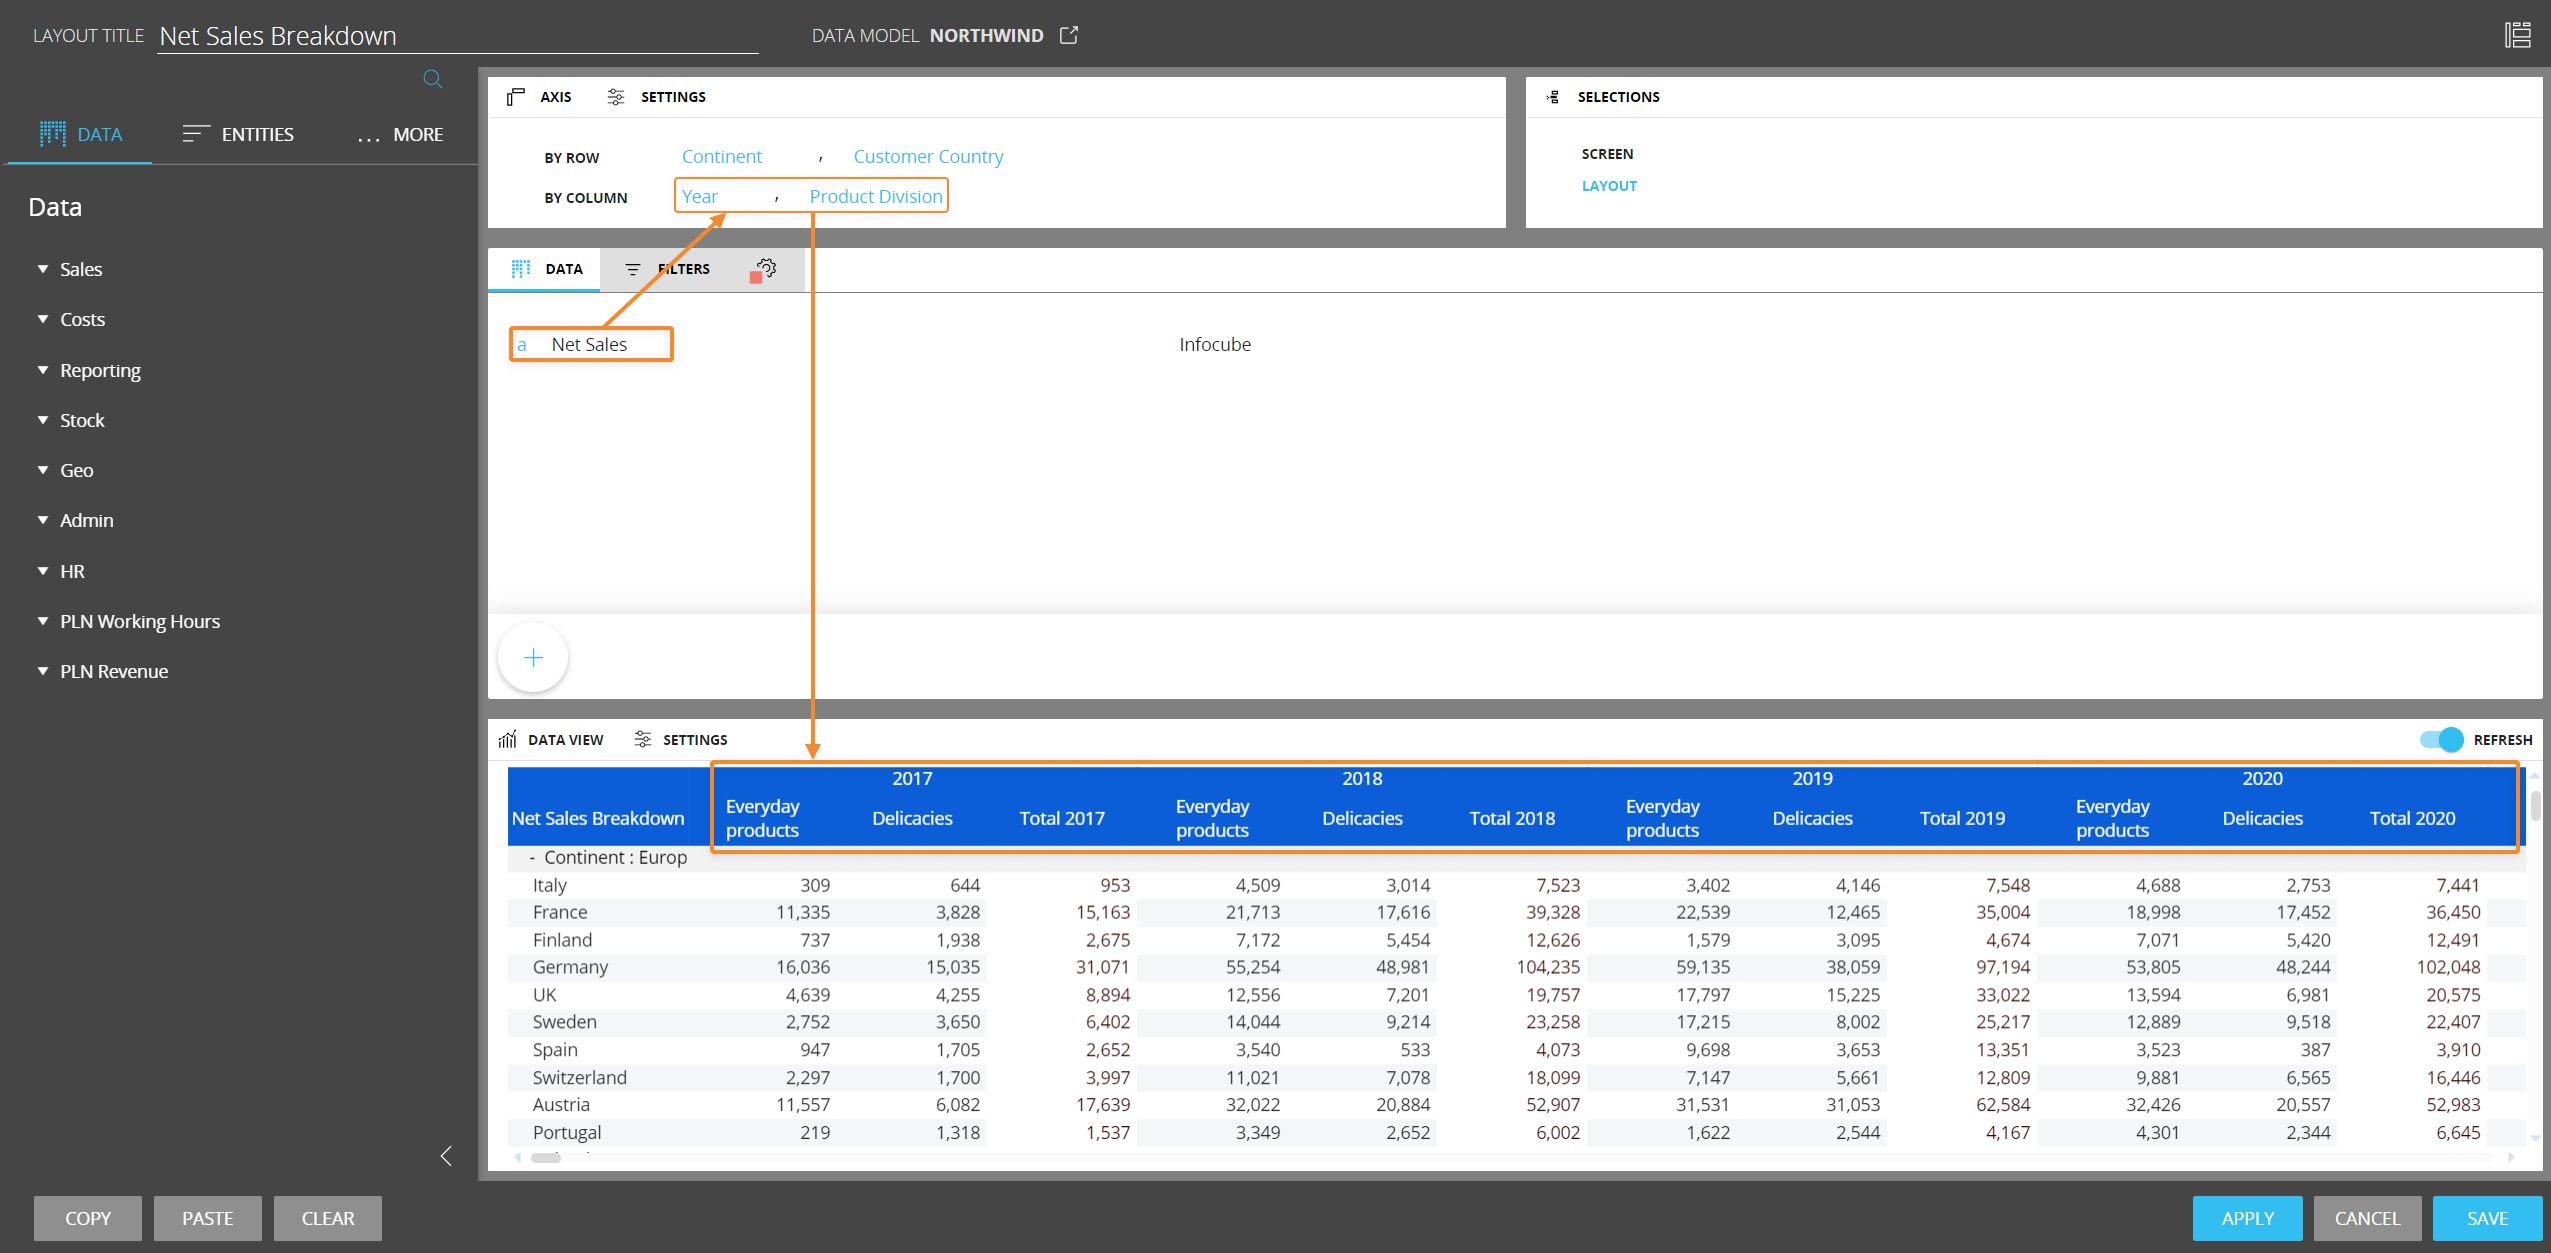
The Data View in the Object preview pane is interactive: you can sort data by clicking on the table headers, expand/collapse groups and see any applied Block settings in action.
Object properties
In the Layout editor, under the Object properties panel, the following options are available.
The "Collapse groups" option, if enabled, shows Entity groups in the Data View collapsed by default.
The "Differentiate zero and null" option, if enabled, makes Board handle 0 and empty values differently when these values are shown in cells or entered with a data-entry action.
When this option is active, the Data View will show:
- An empty cell when no value is entered by the user or when there isn't any value for the corresponding combination of Entities and Data Blocks
- The number 0 when the 0 value is entered by the user or when the value coming from the corresponding combination of Entities and Data Blocks is 0. To save the 0 value entered by the user, the "Hide zeroes" option must be enabled on the Data blocks In the Layout editor
The Alignment menu allows you to configure the alignment of totals and/or Blocks.
When that "Blocks alignment" option is set to "Vertically", the values of the Layout Blocks are displayed on rows in the Data View, rather than on columns (default setting). This is particularly useful, for example, when you have a report displaying various KPIs in rows (each KPI being a Block of the Layout) and you need to perform writeback operations.
When the vertical alignment is enabled, data entry is not available.
An Entity set by Column is required for vertically aligned Layouts. Multiple entities by Column are not supported.
You can also add an Entity by Row, if needed. Multiple entities by Row are not supported on vertically aligned Layouts.
The drill feature is not supported on vertically aligned Layouts.
The Nexel feature is not supported on vertically aligned Layouts.
The Column appearance menu allows you to configure how cells should look.
Click on SETTINGS in the Object preview pane to open the Object properties panel. The following options are available in the dropdown menu for each Data Block:
- Default
- Checkbox
- Button
You can also click the pencil icon to configure a Drill-to-screen on one or more Data Blocks. See Drill-related paragraphs in this page for more details.
The Sparkline option
In the Layout editor, under the Object properties menu, the Sparkline option allows to include charts that provide a visual representation of data right in the Data View.
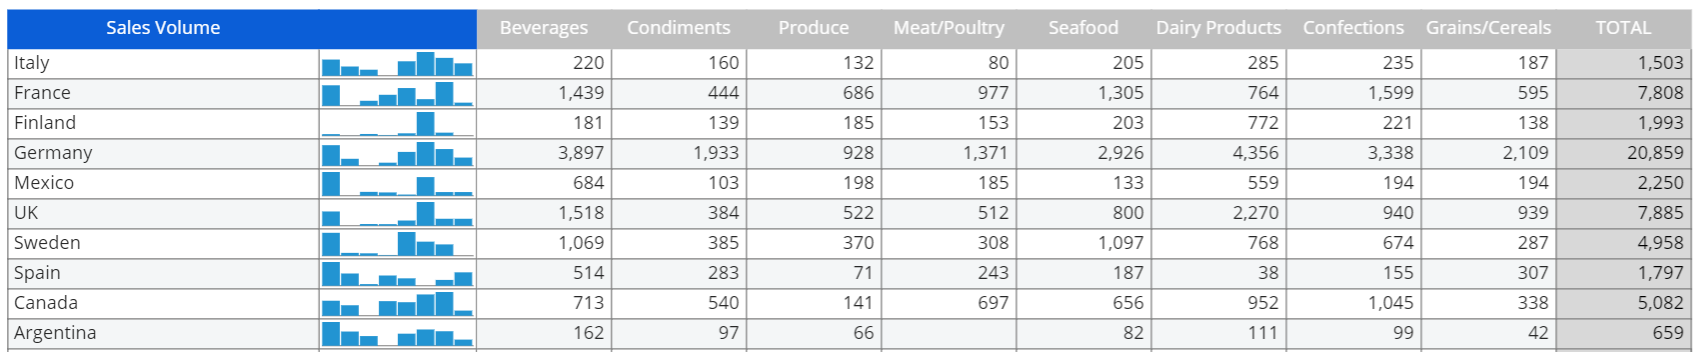
Charts are always displayed after each row header and can be of two different types:
- Line chart. The line chart is displayed when a time entity is set by column
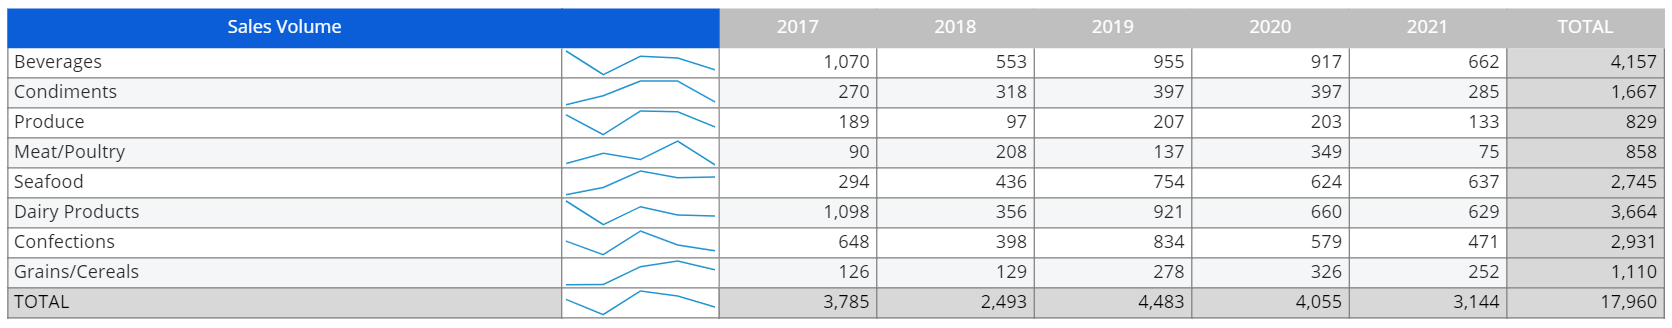
- Bar chart. The bar chart is displayed when a non-time entity is set by column
To configure the Sparkline option, proceed as follows:
- Open the Layout editor and click on Settings in the Object preview pane to reveal the Object properties panel on the right
- Turn on the SPARKLINE option and select one or more Blocks the chart will be based on
- Click APPLY to close the Object properties panel. The chart will be immediately visible in the Object preview
To display a meaningful chart, the Sparkline option requires at least one Entity set by row and one Entity set by column.
For more options and settings, please see Formatting a Data View and About Objects.
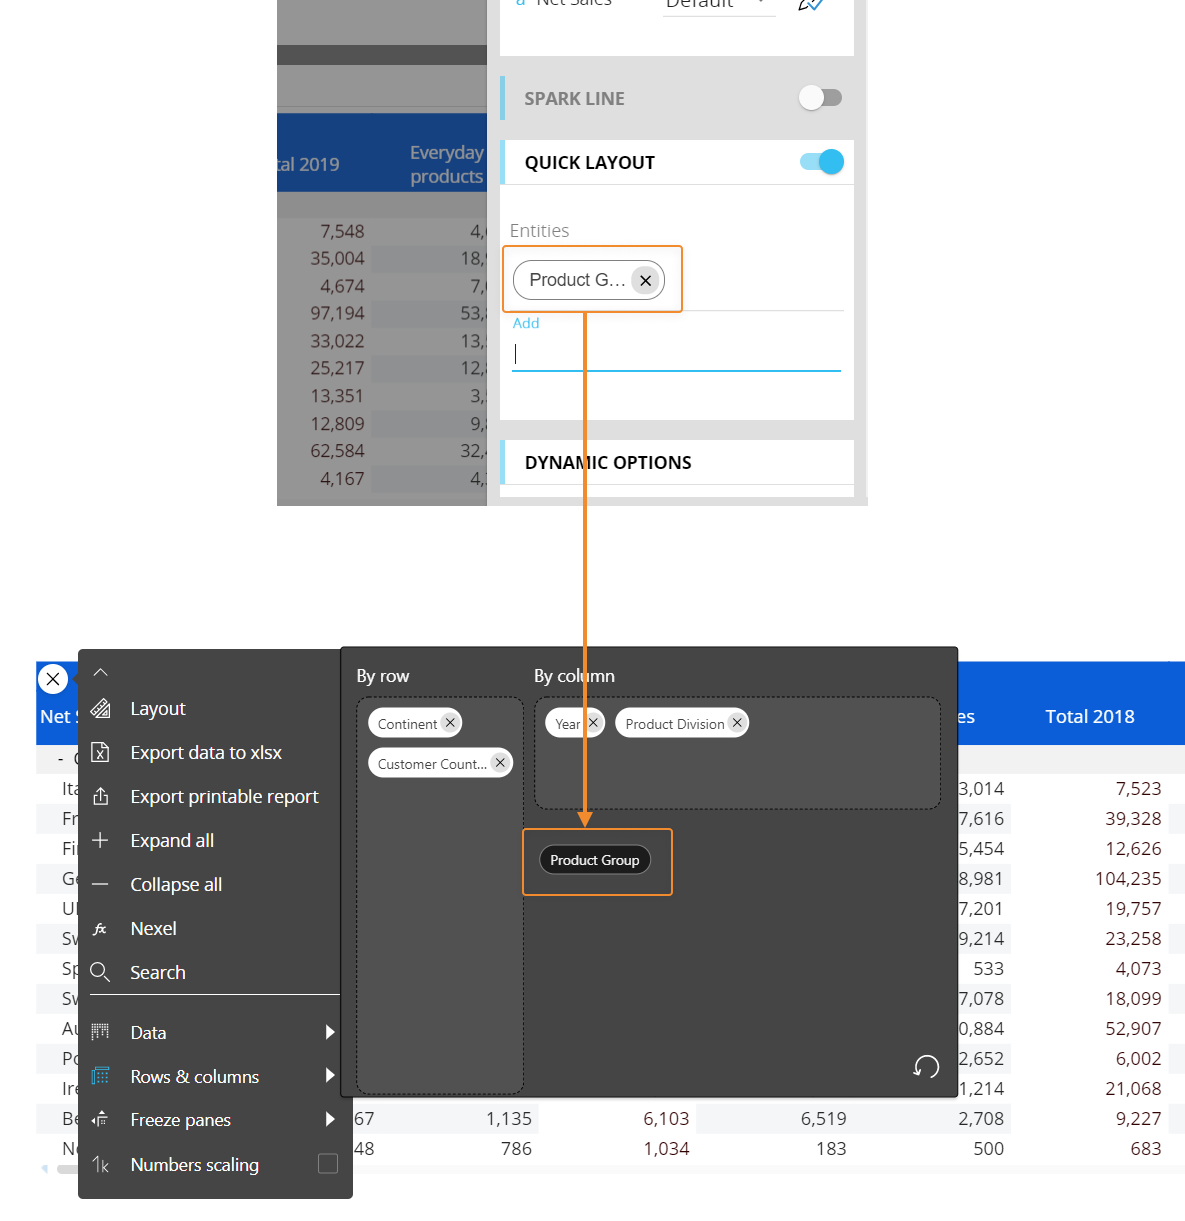
Quick Layout
The Quick Layout feature allows you to configure additional Entities for the user to add or remove from the Layout in Play mode. This feature is particularly useful when the full Layout Editor is disabled in Play mode, but you still want to allow users to see data for different Entities.
Data View Properties
The main Data View properties are available from the contextual right panel of the Screen editing page once the Data View is selected and it's associated with a Layout.
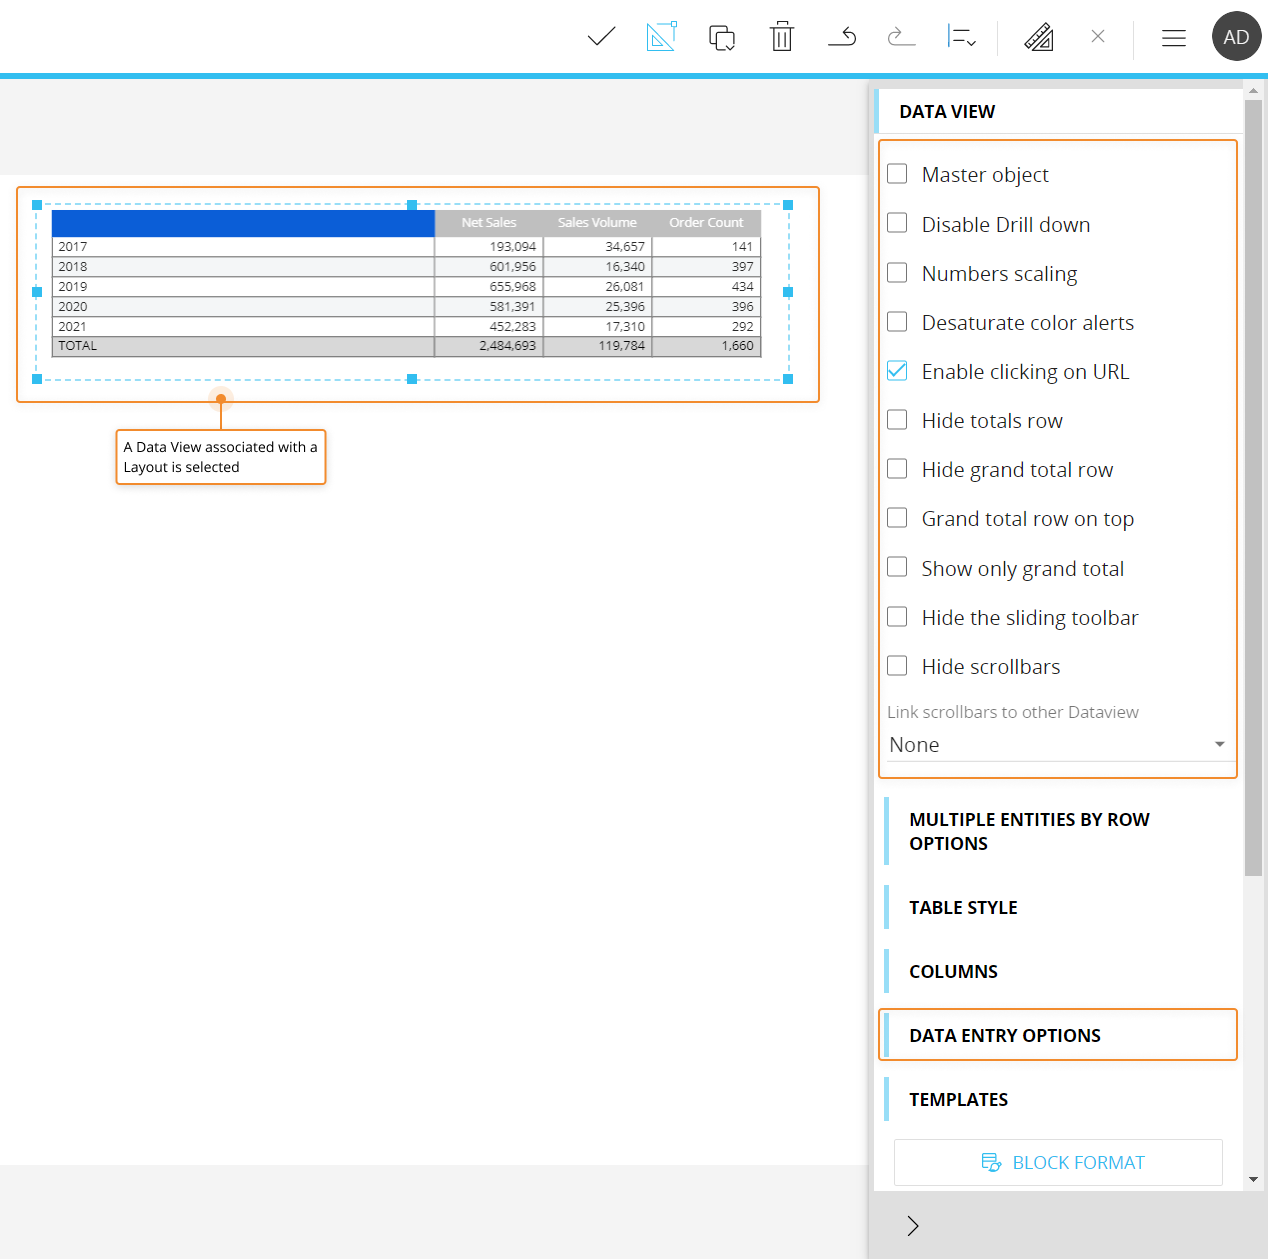
They are the following:
- Master object. If enabled, clicking on a row header (i.e. the Entity members set by row) will update the data displayed by all other Objects on the Screen in order to show only the data relating to the clicked header. The Master object result is similar to applying a Screen Selection
- Disable Drill down. Disables the drill-down functionality on the Data View both in Design and Play mode
- Numbers scaling. Displays large numbers in a shortened format with one decimal place, adding a "K" for thousands, "M" for millions or "B" for billions. For example 12'543'000 is automatically displayed as 12.5 M
- Desaturate color alerts (enabled by default). Displays different shades of colors configured in the Color alert option of the Layout based on actual cell values. If disabled, only the colors configured in the Color alert option are displayed. This option applies to Figures, Blocks and Blocks only alert formats
- Enable clicking on URL (enabled by default). Makes URLs displayed in a Data View clickable. Clicking on a URL opens a new tab and displays the linked web page
- Hide totals row. Hides the total rows
- Hide grand total row. Hides the grand total row
- Grand total row on top. Displays the Grand Total row on top
- Show only grand total. Displays only the Grand Total row and hides all other rows of the Data View
- Hide the sliding toolbar. Prevents the sliding toolbar icon from appearing when you hover over the Data View in Play mode
- Hide scrollbars. Hides both the horizontal and vertical scrollbar
- Link scrollbars to other Dataview. This option "links" the scrollbars of two or more Data Views so that, when you scroll on one, all other linked Data Views scroll as well. To choose the Data View to link to, select it in the dropdown menu. The option requires the configuration of the Layout axis area on both Data Views (By Row and/or By Column fields) to be exactly the same
Under the Data entry options menu, the following options are available:
- Disable pattern based allocation at cell level. Disables the pattern based allocation option on a Data view with data entry enabled. If enabled, you will need to add a Button to your Screen and configure it in order to save all pattern based data entry actions. In this case, all entered values will be saved using the Button.
See Data Block settings to know more about the data entry option and the pattern based allocation - Set trigger. Allows to select a Board Procedure which will be automatically triggered immediately after data entry is performed on the Data View. This feature is useful when you want to automatically update calculations on a Cube that depends on another Cube as users enter data in it: for example, you can use it to recalculate the Forecast Amount Cube as the Forecast Quantity changes.
- Disable screen refresh after execution. Disables the automatic refresh of Screen Objects after the triggered Procedure has finished running (in this case, be sure to include a Refresh Screen action in the triggered procedure in order to always show updated data)
The Set Trigger option works only on a Data View where data entry is enabled on one or more columns.
The execution of the Procedure affects only rows containing data that has been modified and saved.
Interacting with a Data View in Design mode
In Design mode, the Data View provides the same interactive features available in Play mode, with a few notable differences regarding Drill functions.
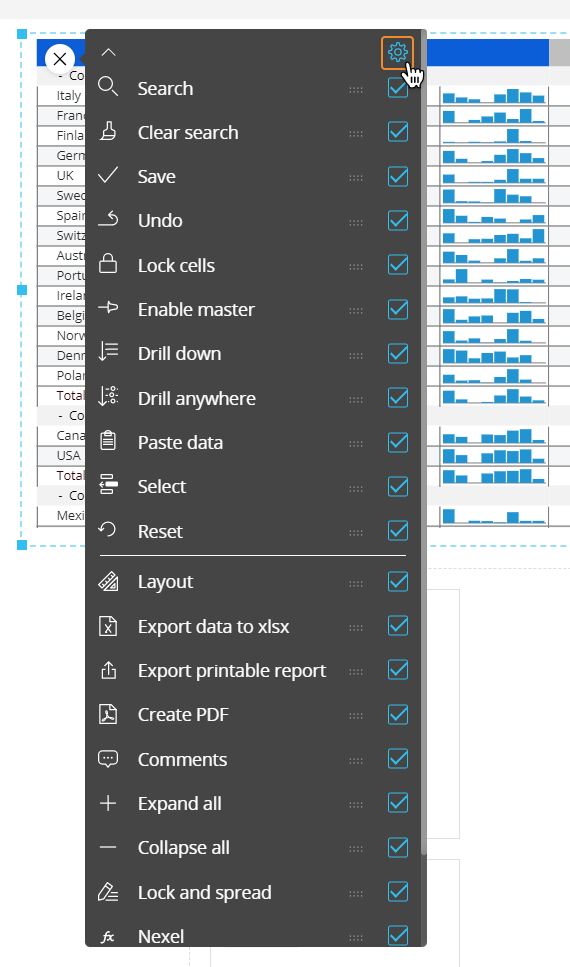
You can also configure which options will be available in the contextual menu in Play mode. To do so, hover over the Data View and click the contextual menu icon (![]() ) in the top left corner, then expand it by clicking on the downward facing arrow: the configuration panel is accessible from the gear icon in the top right corner.
) in the top left corner, then expand it by clicking on the downward facing arrow: the configuration panel is accessible from the gear icon in the top right corner.
Default drill-down
You can configure a drill down path that will be saved in the Data View configuration: that will be the default drill that will be performed in Play mode, when end users click on the Drill down button or double-click the most nested Entity set By Row.
To configure the default drill, proceed as follows:
- Click on the Drill anywhere icon (
 )
) - From the pop up window, select the Entity to drill down on and click OK. The configured drill is performed
- Close the drill down window and save the Screen. The configured drill is now the default drill, both in Design and Play mode
End users will still be able to configure other drill down paths in Play mode, if they're allowed to do so. See next paragraph for more details.
Screen selections and selections made by the user using Selector Objects (if any) also apply to data in drill down windows.
The Drill down configuration process can also be started by double-clicking on a cell or a row header (a member of the Entity set By Row).
Limit Drill down entities
You can limit drill down paths that end users are allowed to configure by selecting the Entities the user can drill down on.
To do so, while in Design mode, check the "Limit drill down entities" checkbox in the drill anywhere configuration window and select the Entities you want to show to the end user. These entities will be the only ones available during the drill anywhere configuration in Play mode.
You can also configure a default drill down path from the Layout editor. To do so, proceed as follows:
- Select the Data View and open the Layout editor
- Click on SETTINGS in the Object preview pane to open the Object properties panel
- Under the Column appearance menu, select the pencil icon to configure a drill down on one or more Data Blocks as described in bullet point n° 2 of the previous bulleted list
- Save the Layout.
Drill-to-screen
To allow users to drill-down from one Data View to another Screen within the same Capsule with a selection on the selected row header (Entity member by row), proceed as follows:
- Select a cell and click on the Drill anywhere icon ()
- From the pop up window, select the Screen tab and choose the destination Screen. Check the "Same tab" checkbox to open the destination Screen in the same browser tab.
- The Drill to screen mode, if enabled, will open the destination Screen with a selection on the row header (a member of the Entity set By Row) when the user double-clicks on it or selects it and clicks on the Drill-down icon (
 )
) - The Go to screen mode, if enabled, will open the destination Screen when the user double-clicks on a row header (a member of the Entity set By Row) or selects it and clicks on the Drill-down icon (). The destination Screen won't inherit any selection from the Data View
- The Dynamic screen option allow to select a Block (an algorithm) to dynamically change the Screen navigation based on another Block values (a text cube containing Screen names)
- The Drill to screen mode, if enabled, will open the destination Screen with a selection on the row header (a member of the Entity set By Row) when the user double-clicks on it or selects it and clicks on the Drill-down icon (
- Click OK to save the Drill-to-screen configuration.
The Drill-to-screen configuration process can also be started by double-clicking on a cell or a row header (a member of the Entity set By Row).
You can also configure a Drill-to-screen with a selection filter applied based on the row (Entity member by row) from the Layout editor. To do so, proceed as follows:
- Select the Data View and open the Layout editor
- Click on SETTINGS in the Object preview pane to open the Object properties panel
- Under the Column appearance menu, select the pencil icon to configure a Drill-to-screen on one or more Data Blocks. You can also change the cell appearance, by selecting one of the options listed in the dropdown menu.
Check the "Same tab" checkbox to open the destination Screen in the same browser tab.- The Drill to screen mode, if enabled, will open the destination Screen with a selection based on the on the row header (a member of the Entity set By Row) corresponding to the cell selected or double-clicked by the user in the Data View
Screen selections and selections made by the user using Selector Objects (if any) also apply to data in the target Screen.
- The Go to screen mode, if enabled, will open the destination Screen when the user double-clicks on a cell of a configured Block or selects it and clicks on the Drill-down icon (). The destination Screen won't inherit any selection from the Data View
- The Dynamic screen option allow to select a Block (an algorithm) to dynamically change the Screen navigation based on another Block values (a text cube containing Screen names)
- The Drill to screen mode, if enabled, will open the destination Screen with a selection based on the on the row header (a member of the Entity set By Row) corresponding to the cell selected or double-clicked by the user in the Data View
- Save the Layout.
This feature allows you to nest your analysis in a more powerful way than the standard drill-down, which only changes the level of granularity of a report. In a drill-to-screen navigation the data represented (values, indexes) and types of objects (Charts, Dashboards, Data Views) may vary as the user drills from a top level view to another screen at a more detailed level.
Drill-procedure
It is possible to trigger a Procedure from a cell of a Data View, when the user double-clicks on a row header (Entity member set by row) or a cell. The Procedure is launched with a selection filter applied based on the clicked Entity member or the row and column item corresponding to the clicked cell.
If a drill-procedure containing two or more Procedures is configured, when the user double-clicks on a cell, a pop-up window allows the user to select the Procedure to run from a configured list.
To configure a drill-procedure on a row header (Entity member by row), proceed as follows:
- Select a cell and click on the Drill anywhere icon ()
- From the pop up window, select the Procedure tab and choose the desired Procedures.
- If the checkbox in the middle is unchecked, the dropdown menu on the left allows to choose from procedures saved at the Capsule level
- If the checkbox in the middle is checked, select a Data model from the dropdown menu on the right. By doing so, only Procedures belonging to the chosen Data model will be shown in the dropdown menu.
After you've chosen the desired Procedure, click the ADD button on the right. Repeat the process for each Procedure you want to add to the drill
- Click OK to save the Drill-procedure configuration.
The Drill-procedure configuration process can also be started by double-clicking on a cell.
You can also configure a Drill-procedure with a selection filter applied based on the row (Entity member by row) from the Layout editor. To do so, proceed as follows:
- Select the Data View and open the Layout editor
- Click on SETTINGS in the Object preview pane to open the Object properties panel
- Under the Column appearance menu, select the pencil icon to configure a Drill-procedure on one or more Data Blocks as described in bullet point n°2 of the previous bulleted list. You can also change the cell appearance, by selecting one of the options listed in the dropdown menu
- Save the Layout.
Screen selections and selections made by the user using Selector Objects (if any) also apply to data in the triggered Procedure.
Drill through
It is possible to execute a Drill through from a cell of a Data View, when the user double-clicks on a row header (Entity member set by row) or a cell. The Drill through is executed with a selection filter applied based on the clicked Entity member or the row and column item corresponding to the clicked cell.
Drill throughs are configured in the Drill through section of the Data model.
To configure a Drill through on a row header (Entity member by row), proceed as follows:
- Select a cell and click on the Drill anywhere icon ()
- From the pop up window, select the Drill through tab and choose the desired Drill through
- Click OK to save the Drill through configuration.
The Drill through configuration process can also be started by double-clicking on a cell.
You can also configure a Drill through with a selection filter applied based on the row (Entity member by row) from the Layout editor. To do so, proceed as follows:
- Select the Data View and open the Layout editor
- Click on SETTINGS in the Object preview pane to open the Object properties panel
- Under the Column appearance menu, select the pencil icon to configure a Drill through on one or more Data Blocks. You can also change the cell appearance, by selecting one of the options listed in the dropdown menu
- Save the Layout.
Screen selections and selections made by the user using Selector Objects (if any) also apply to data in the Drill through.
Learn more about:
- The Data View Object
- Formatting a Data View
- Interacting with a Data View
- The Nexel calculation layer