Capsules
A Capsule is a collection of Screens and Procedures: each Capsule is essentially made of your reports, displayed and organized so as to allow a simple identification of insights and other useful information for decision-making purposes. Screens may contain tables, charts, buttons, text annotations and other data presentation objects.
A Capsule doesn’t store any data, it only contains the report definitions (the Layout) and the definitions of data presentation objects (tables and charts). Whenever a Capsule is opened, the data is freshly retrieved from the Data model: all objects inside a Capsule synchronize with each other and with the Data model so that they automatically react to the actions of the user.
A Capsule can contain several Screens. A Screen can include tables, charts, and other data visualization tools. It can also include Capsule navigation elements, such as buttons and menus.
Capsules can have different purposes: Capsules made for analysis, with reports that include charts and tables, Capsules made for Corporate Performance Management and Business Intelligence that combine reporting with data-entry and simulation Screens, or Capsules made for Applications settings administration and so on.
See "About Capsules" for more information.
Examples of Screens of a Capsule
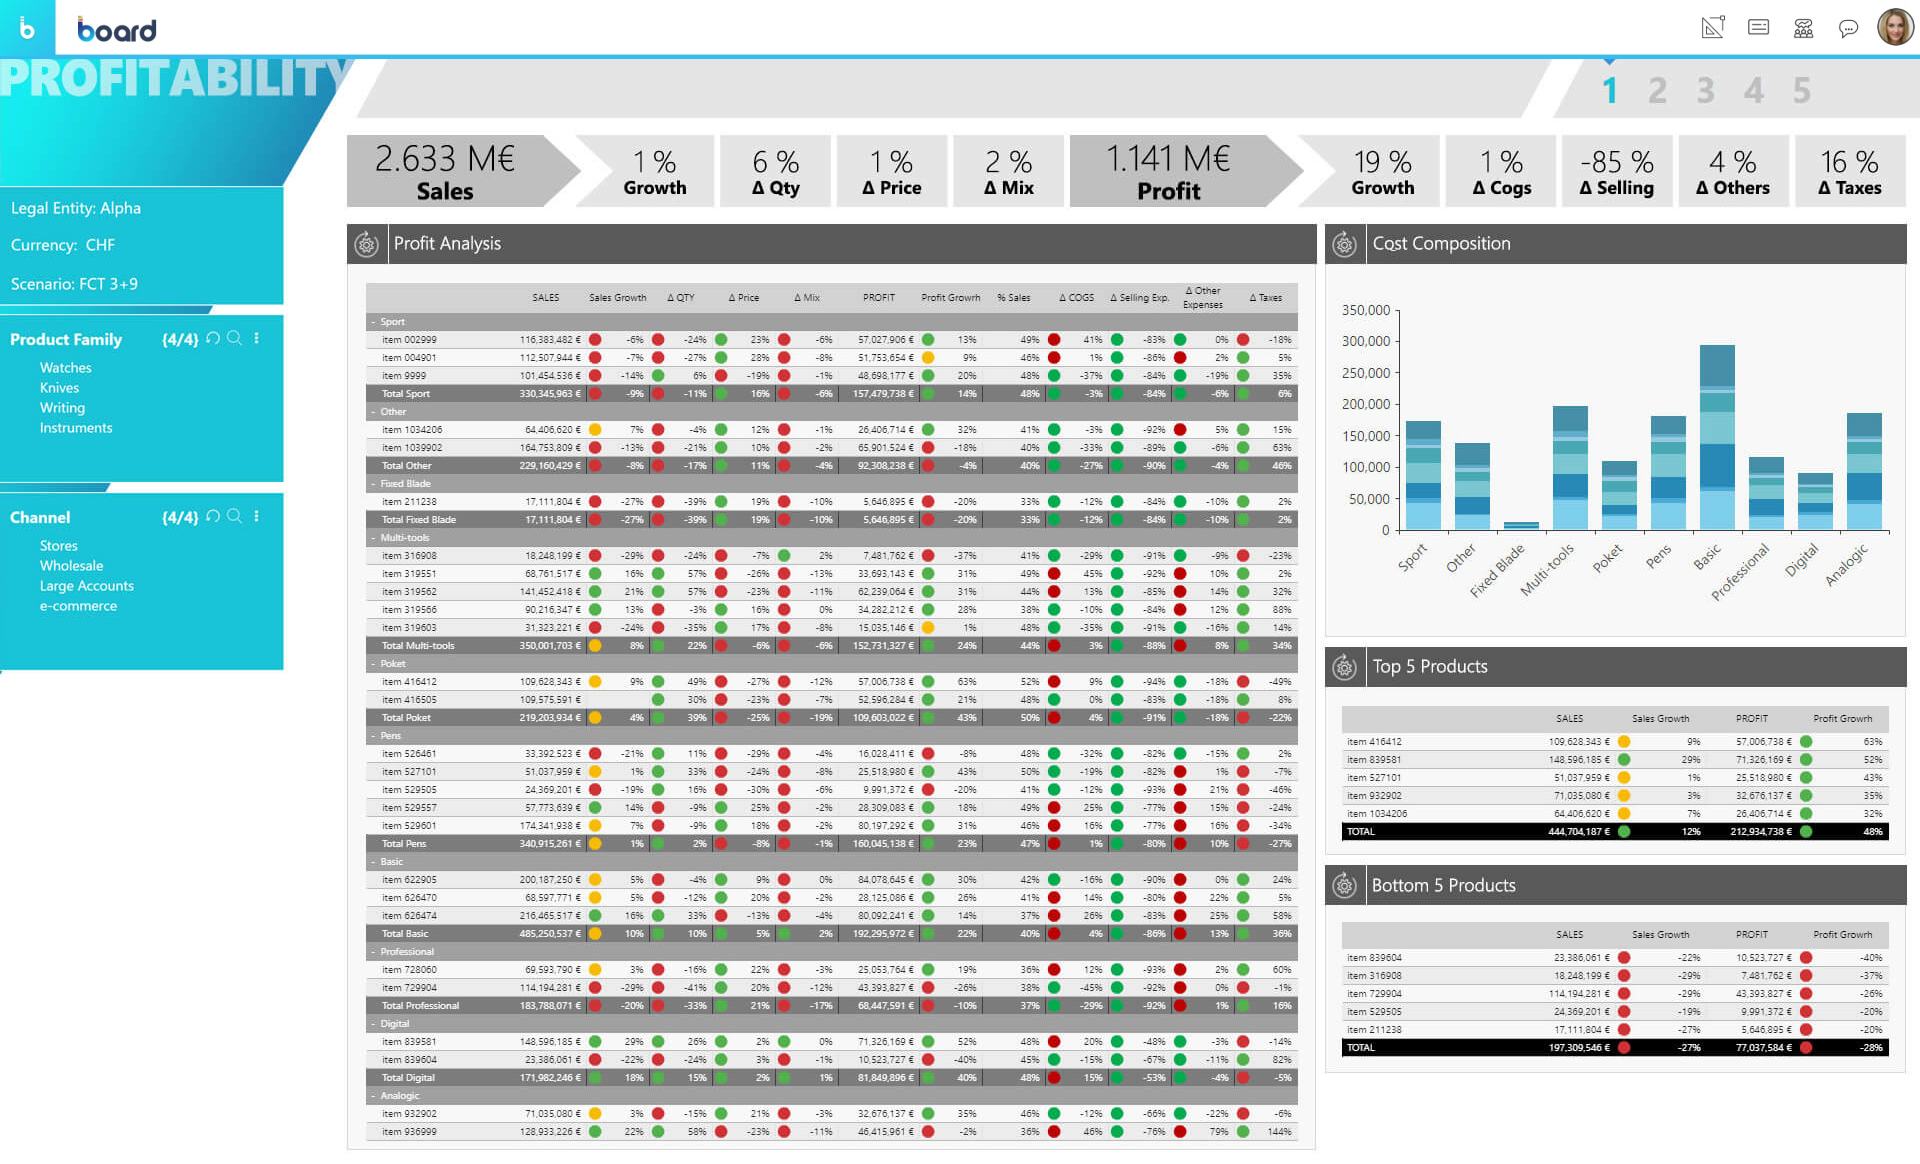
A Screen containing a combination of Objects: Data Views, a bar chart, a Menu, Selectors and Labels with custom text.
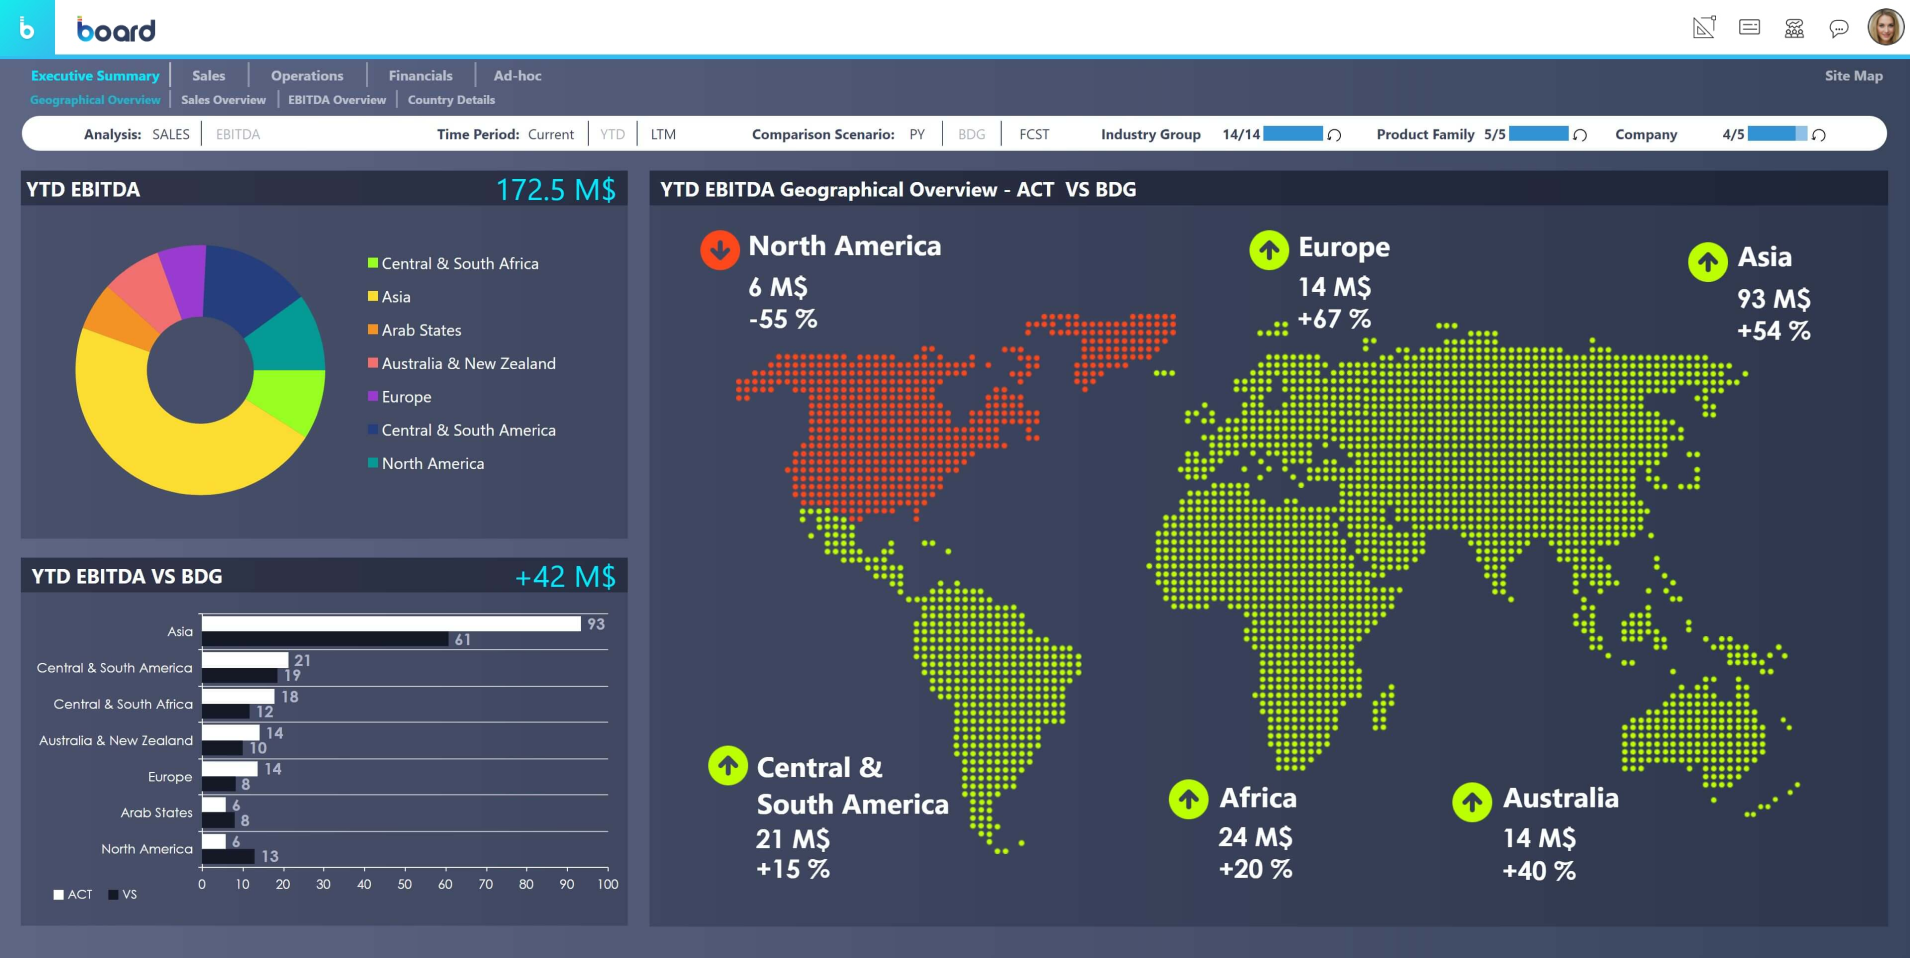
The following is a typical dashboard providing a high level view on some business metrics through graphical representations and charts.

Another example of a useful Screen Object is the following geographical map - with small bubbles displaying earnings and colors to highlight predefined conditions - and related charts.