The Chart Object
Board's Chart Object helps you visualize your data in a more meaningful way and it is extremely useful for identifying patterns and recurring trends.
The Chart Object allows you to create and format a wide variety of charts, including pie charts, bar charts, radar charts, waterfall charts and many more.
All Charts, just like every other Screen Object in Board, are highly interactive and give users new ways of exploring information and data: they offer features such as zooming, master layout, drill-down and interactive selection.
Board gives you many chart types to experiment with, allowing you to create your own combination to make it easier to analyze your data.
These Chart Objects complement, and can be used in conjunction with, existing Screen Objects as well as Containers.
Chart types
There are eight types of charts, all working in the same way but displaying data differently:
- Cartesian
- Pie
- Waterfall
- Radar
- Bubble chart
- Bullet chart
- Heatmap
- Treemap
Examples
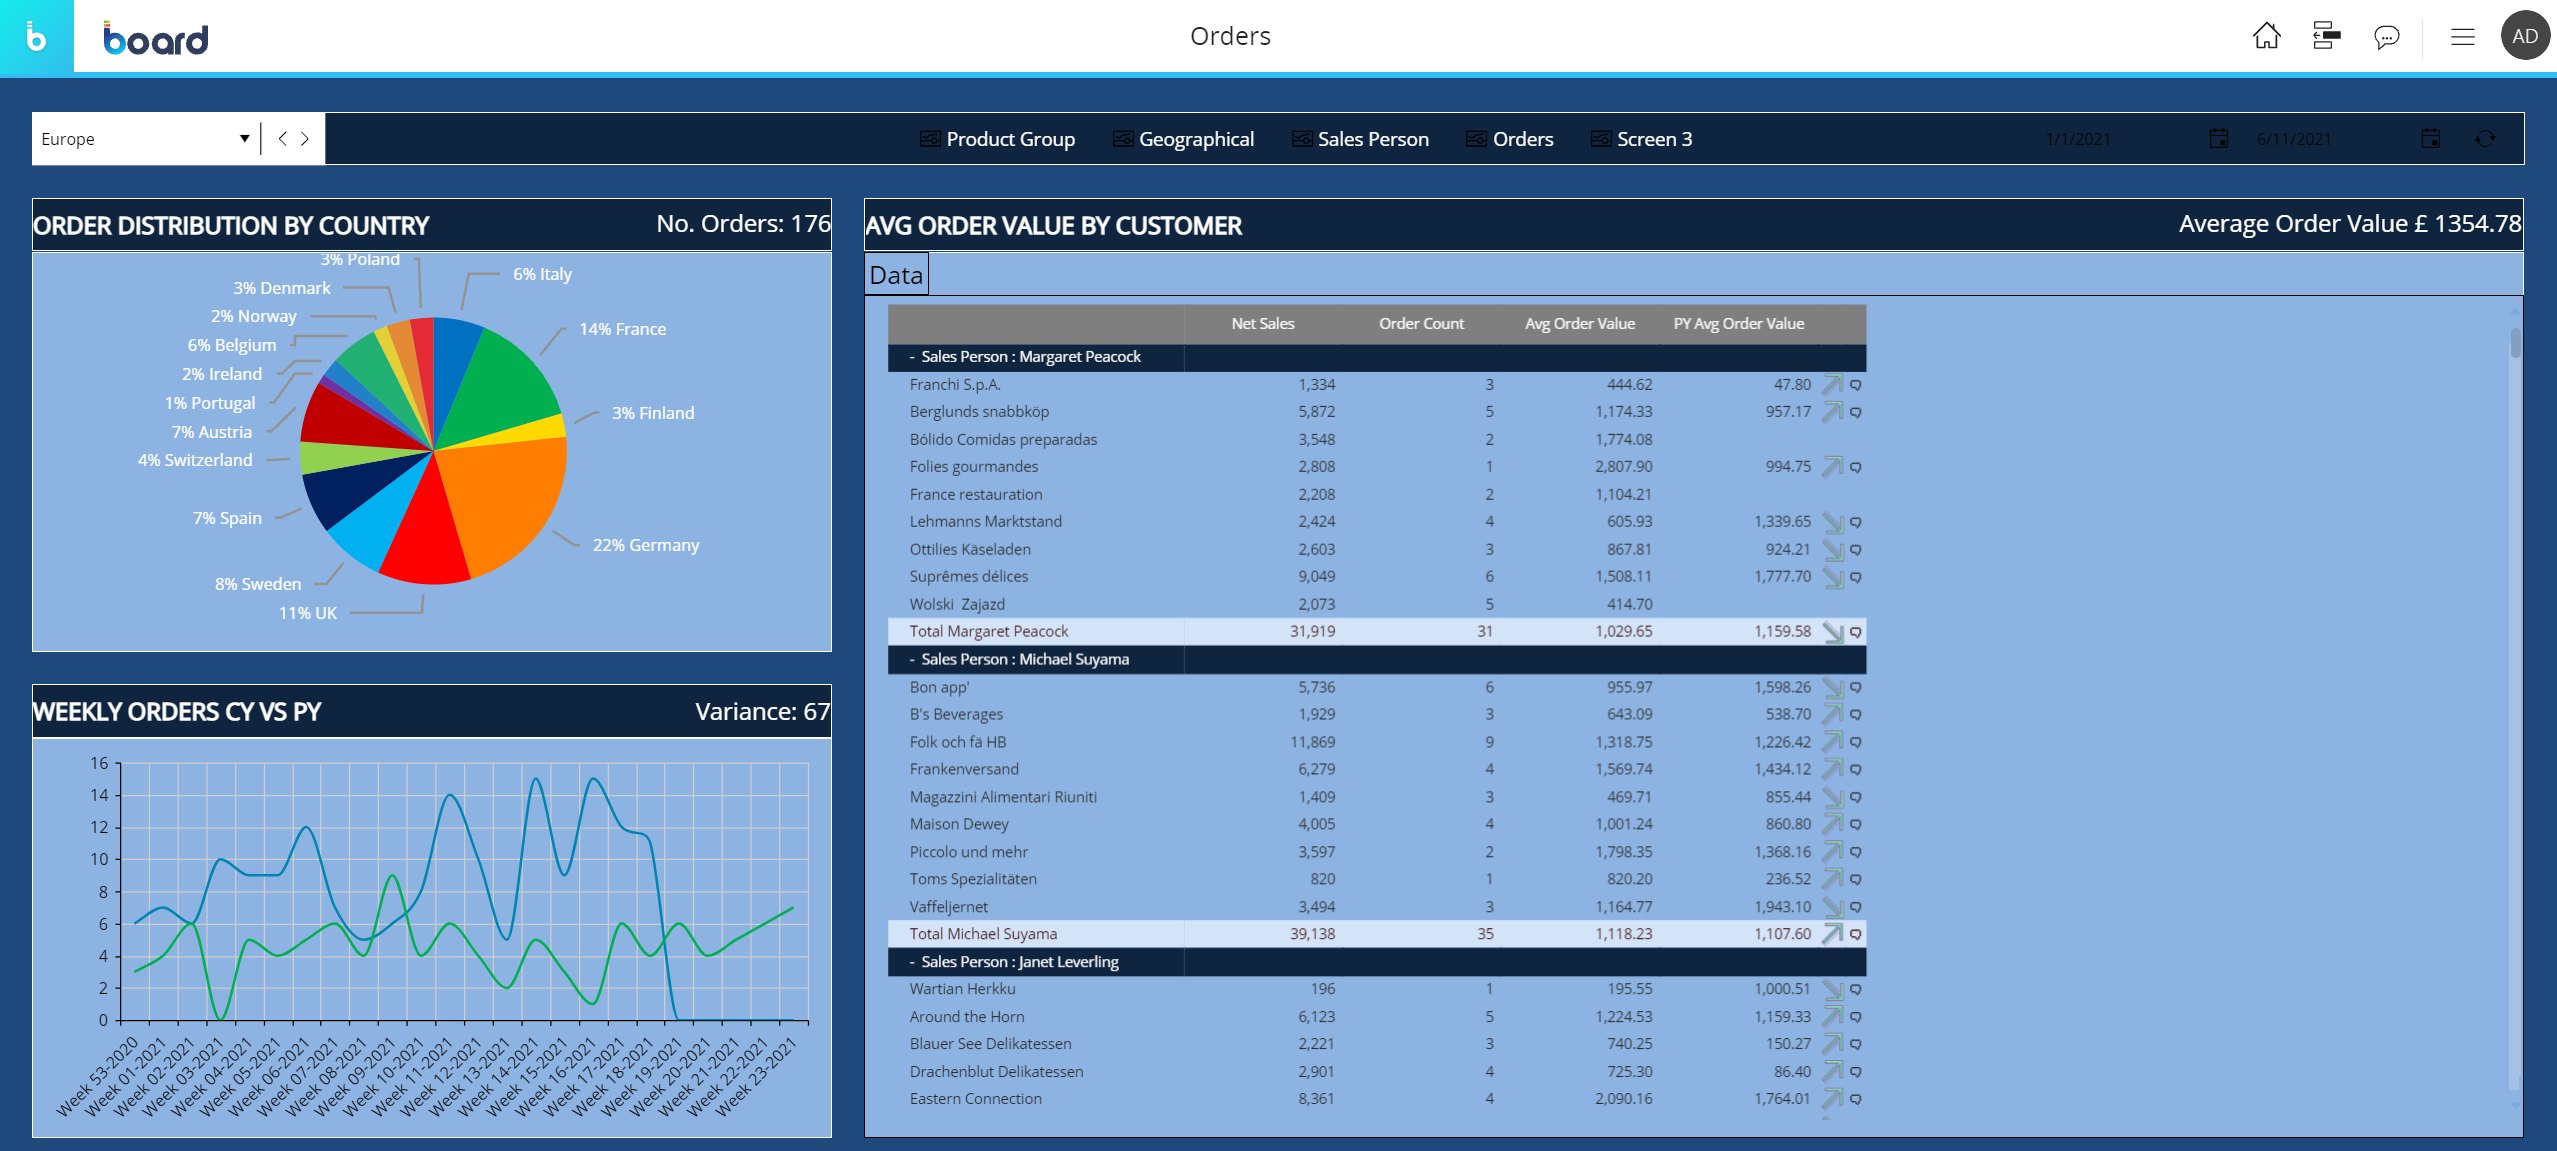
The following picture shows two charts, a Pie chart and a Spline chart, in a Screen covering purchase orders.
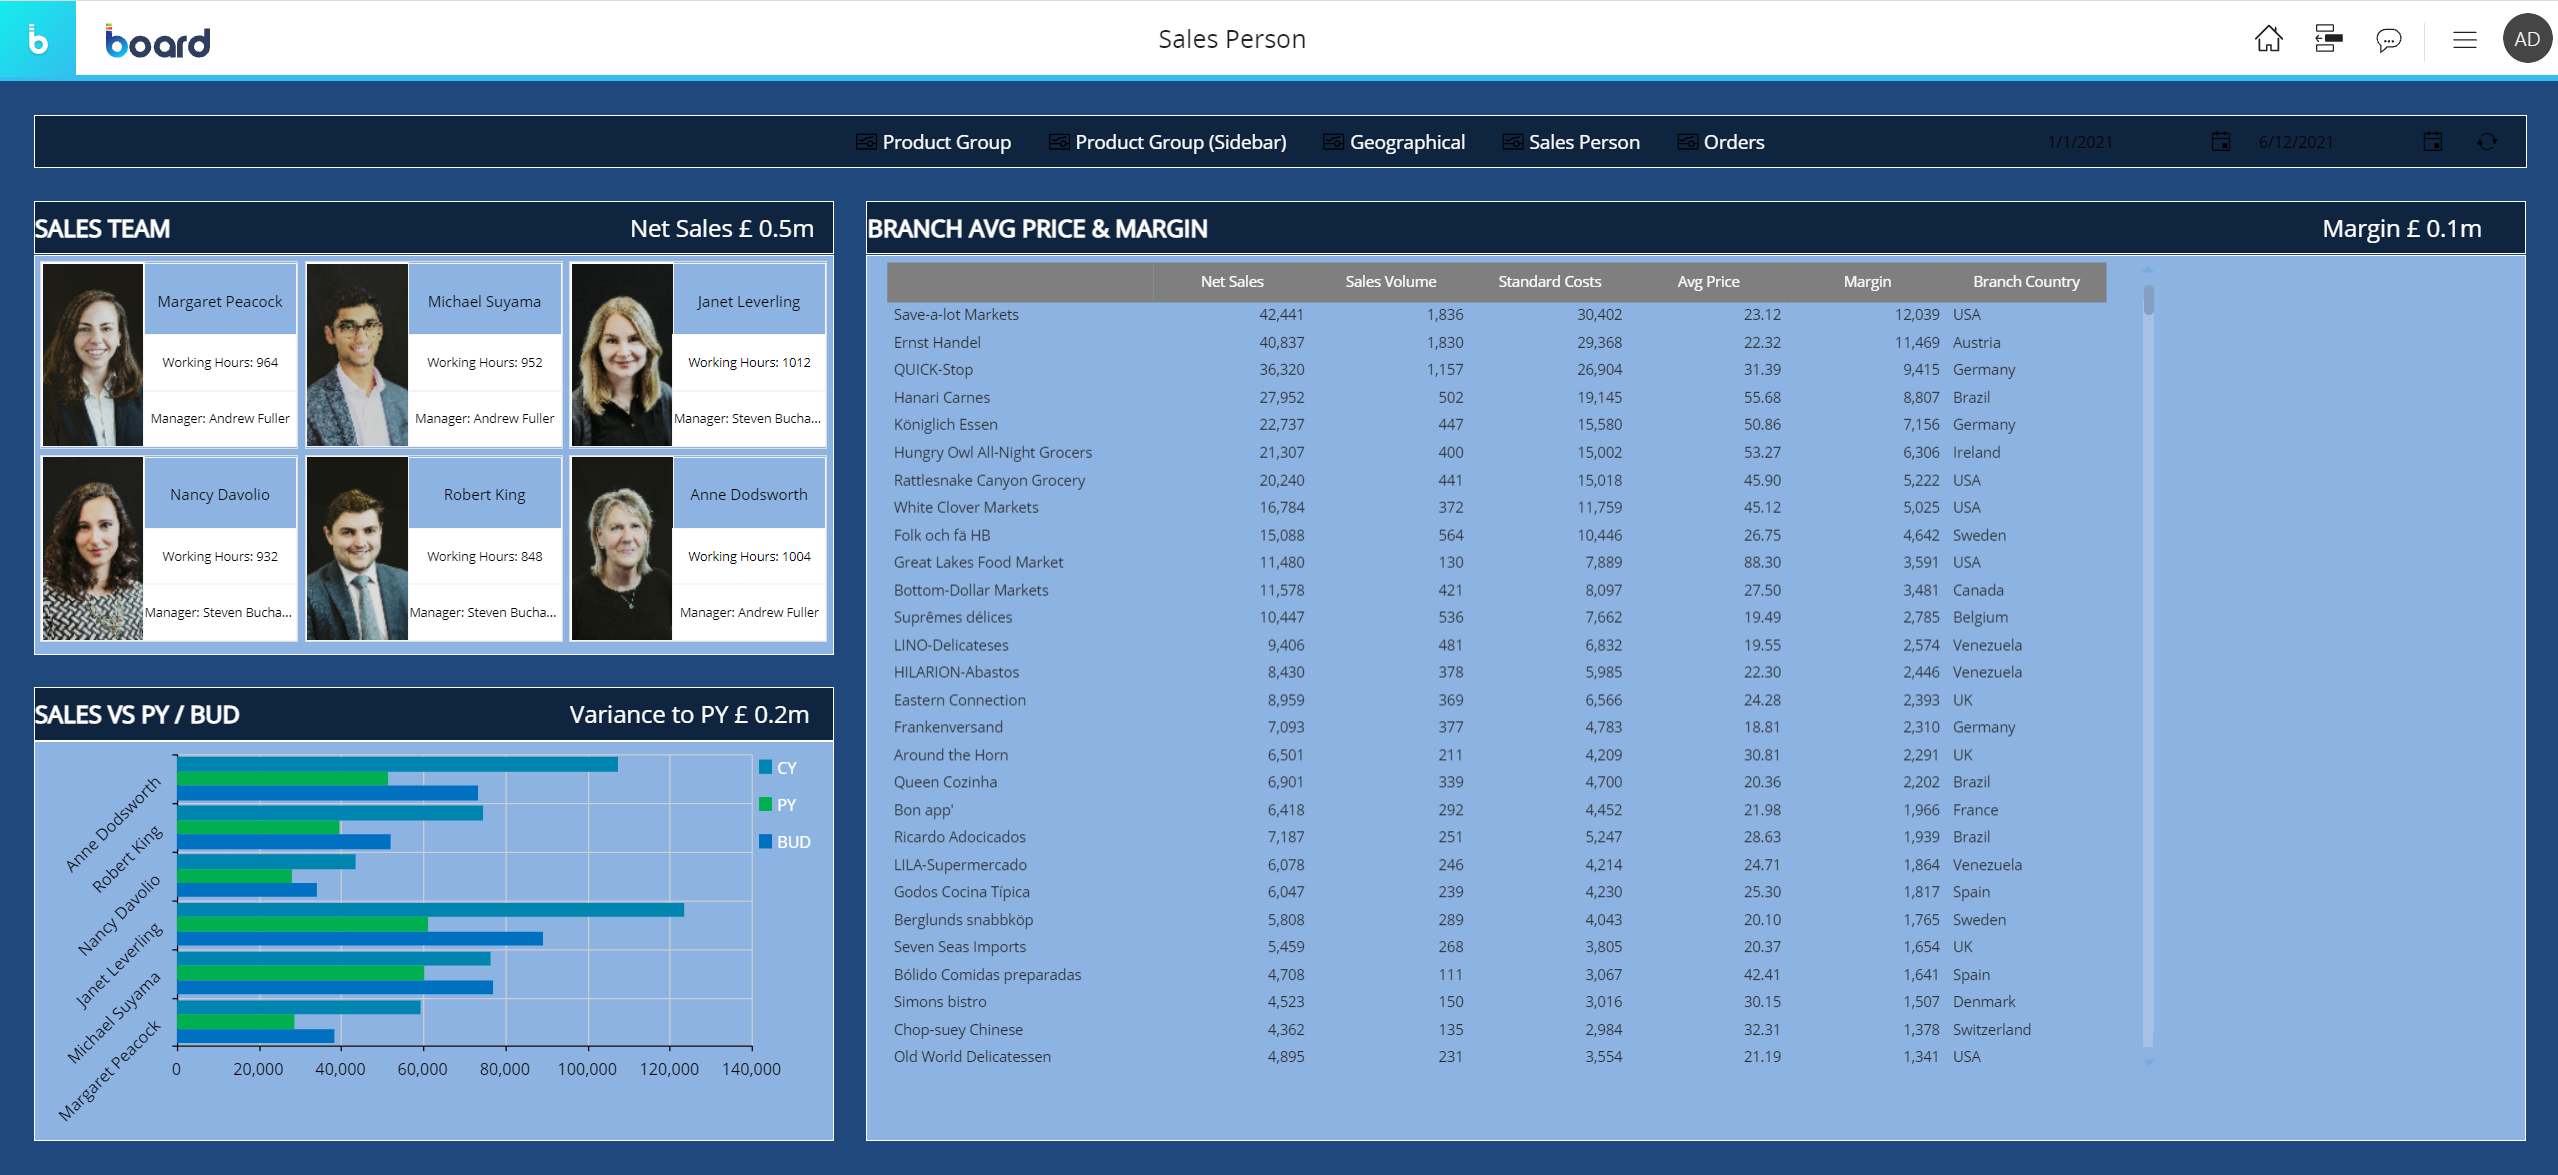
In the following picture, a Bar chart compares the performance of each sales person between the current year and the previous year.
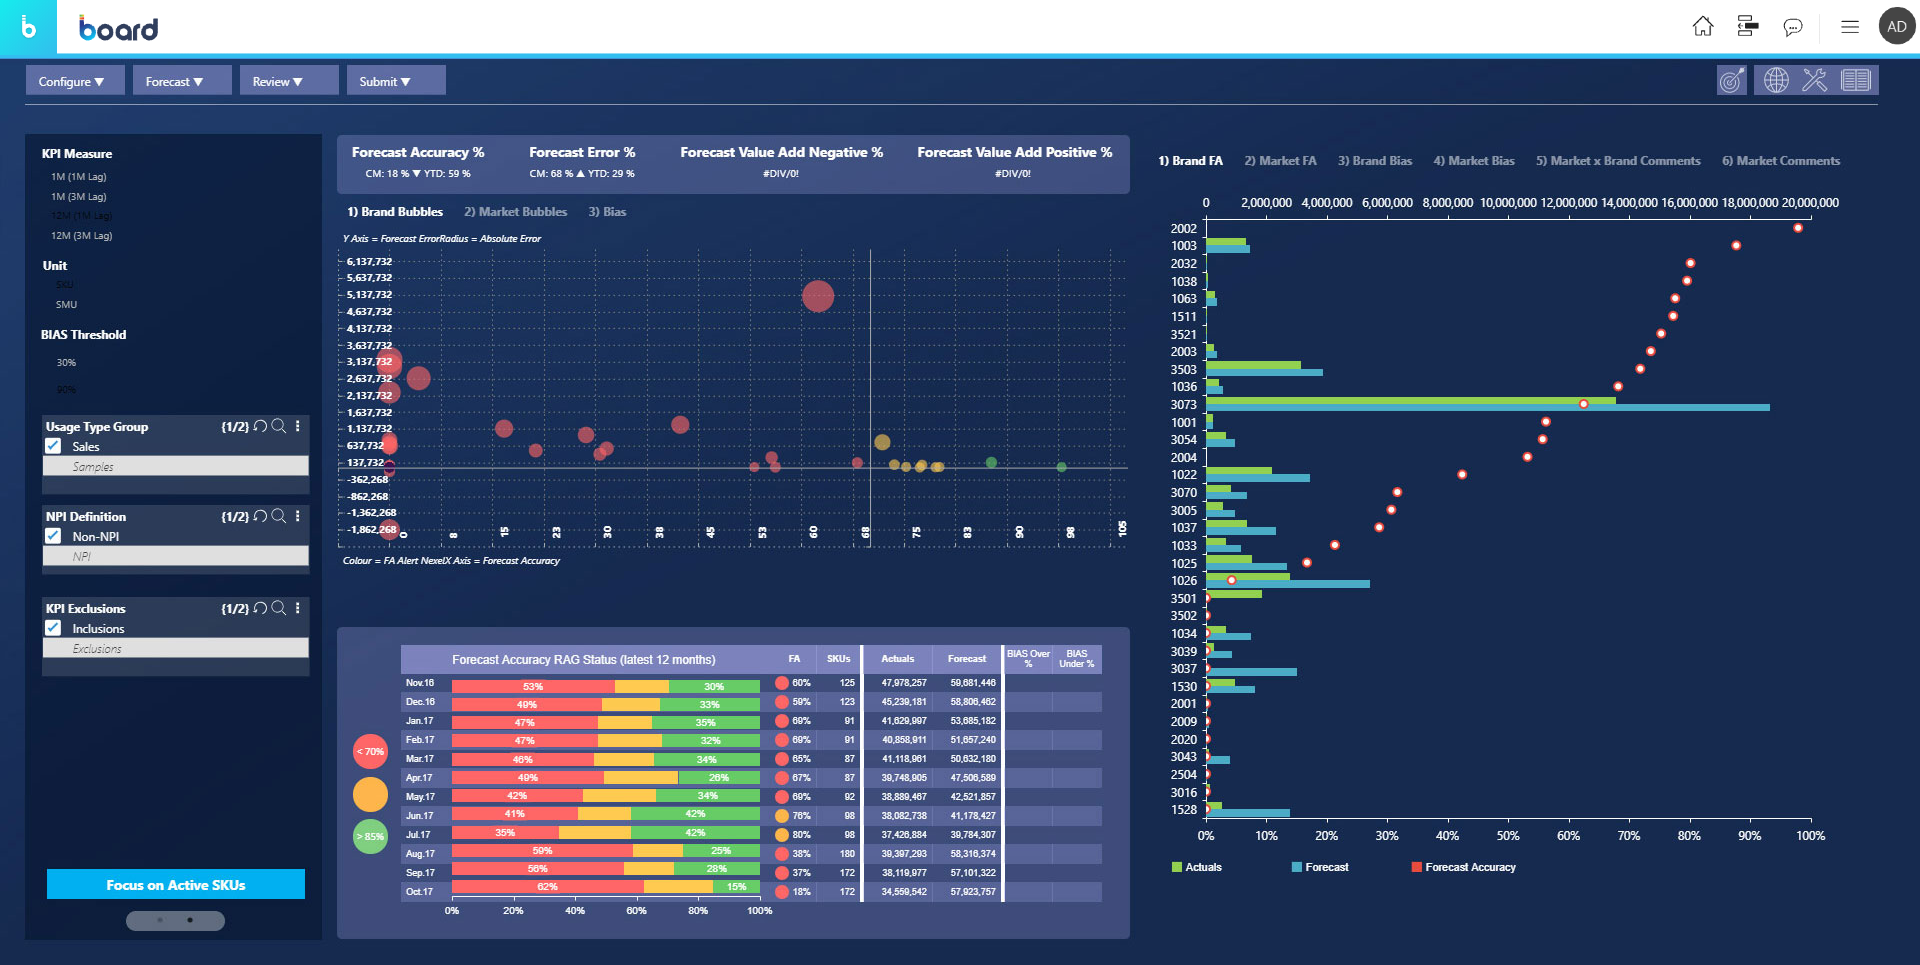
In the following Screen, two chart analyze forecast data:
Learn more about: