Interacting with an OpenStreetMap
The OpenStreetMap Object provides the following interactive features:
-
Map popover
-
Map settings and appearance customization
-
Pan, zoom, interactive selection
-
Master
-
Drill anywhere
-
Drill-down
-
Drill-to screen
-
Drill-procedure
-
Data-entry (in drill down windows)
-
Other features in the contextual menu (sliding toolbar)
Any changes made to the map using the functions listed above will be lost if you leave the Screen or update it, except for data entry actions.
Map popover
When you hover over a map area or a Bubble, a map popover will appear. The popover will display relevant information related to the data point, such as Entity members, values and other map-specific data or settings.
Map settings and appearance customization
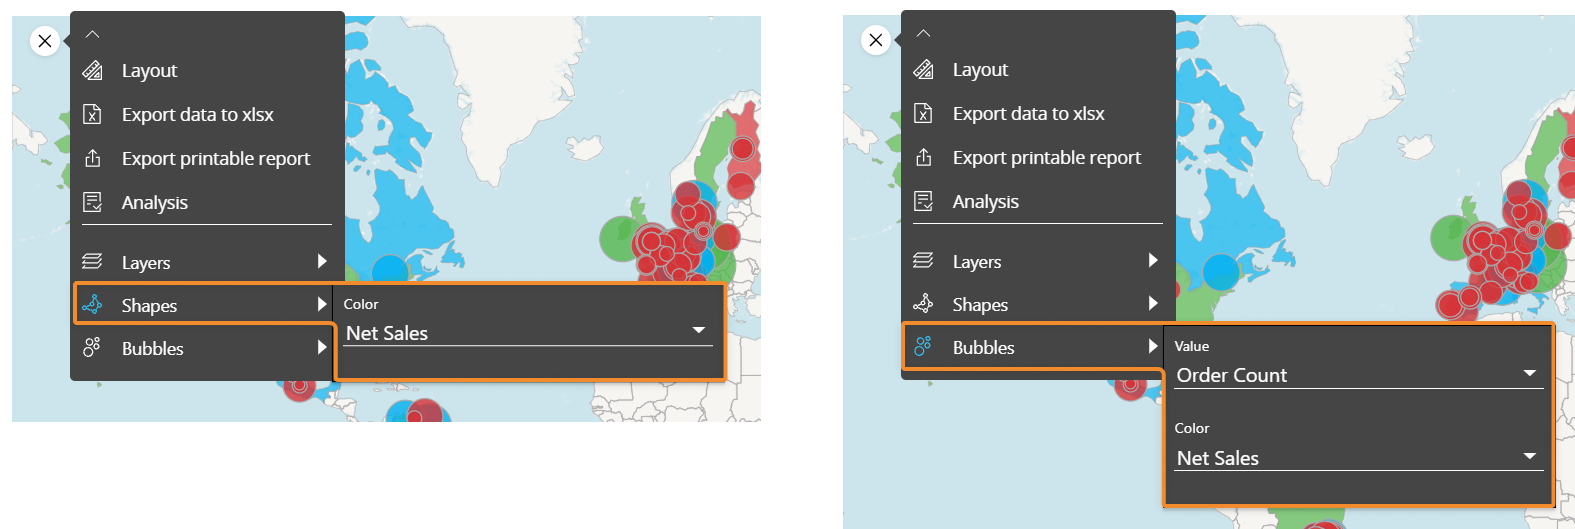
From the sliding toolbar you can customize the map by showing/hiding layers and changing the data that defines the color of Map areas and/or the color and radius of Bubbles.
To show/hide Layers, expand the sliding toolbar, hover over the "Layers" option and click the eye icon to customize the map.
To change the data that defines the color of Map areas, hover over the "Shapes" option and select the desired driver from the dropdown list. Do the same for Bubbles by hovering over the "Bubbles" option.
Pan, zoom, interactive selection
Depending on the map configuration, you can perform specific actions.
Available actions are:
- Pan. You can navigate the map by clicking, holding the left mouse button and dragging the mouse in the direction you wish to pan the map. You can also move the map North, South, East or West using the pan arrows in the lower right corner of the Object area (if enabled)
- Zoom. You can zoom in or out the map using the mouse wheel. You can also do this using the plus and minus buttons in the lower right corner of the Object area (if enabled)
- Interactive selection. To apply a selection on a map, select a set of Map areas or Bubbles in the map by holding the CTRL button and clicking on them, then click the Select icon (
 ) that will automatically appear in the sliding toolbar. The selection is applied as a Screen selection and all other Objects on the Screen are updated accordingly.
To reset the selection, click the reset button ( ) in the top left corner of the Object area.
Master
If the OpenStreetMap has been configured as a Master Object, clicking on a data point (a Bubble or a Map area) will update the data displayed by all other Objects on the Screen in order to show only the data relating to the selected element. The Master Object result is similar to applying a Screen Selection.
By clicking on the "Disable master" icon (![]() ) in the sliding toolbar, you can disable this option. Click on the "Enable master" icon (
) in the sliding toolbar, you can disable this option. Click on the "Enable master" icon (![]() ) to re-enable it.
) to re-enable it.
Drill anywhere
The Drill anywhere feature allows you to configure a default Drill-down that will be available for all Bubbles of the map.
To do so, proceed as follows:
- Select a Bubble and click the Drill anywhere icon (
 ) in the sliding toolbar
 - The Entity list you are allowed to drill-down on will appear in the drill configuration window
- Select the desired Entity and click OK to save the drill and to perform it. The configured drill data is always displayed in a Data View
Once the drill is saved, it can be easily performed again on other Bubbles by clicking on the Drill-down icon (![]() ).
).
The Drill anywhere function is available also in the Drill-down windows, so you can create your own drill-down paths at different levels of granularity. Learn more about drilling down in a Data View Object.
Drill-down
Once you have configured a drill using the Drill anywhere feature, click the Drill-down icon (![]() ) to perform it on other Bubbles of the chart.
) to perform it on other Bubbles of the chart.
Drill-to-screen
If a Drill-to-screen has been configured on the map, the Drill anywhere icon (![]() ) won't be available.
) won't be available.
In this case, select a Bubble with a single click and click the Drill-down icon to follow the drill path from the chart to another Screen of the current Capsule.
Depending on the Drill-to-screen configuration, the destination Screen will open with:
- A selection based on the source data point in the chart
- No inherited selection
Drill-procedure
If a Drill procedure has been configured on the chart, the Drill anywhere icon (![]() ) won't be available.
) won't be available.
In this case, select a Bubble with a single click and click the Drill-down icon to trigger the configured Procedure or to choose from a list of available Procedures.
Depending on the Drill-procedure configuration, the Procedure will run with:
- A selection based on the source data point in the chart
- No inherited selection
Data-entry (in drill down windows)
Although maps don't allow it directly, you can perform data entry actions in Data Views displayed in drill down windows. See Data entry on Cubes and Data Block settings for more details.
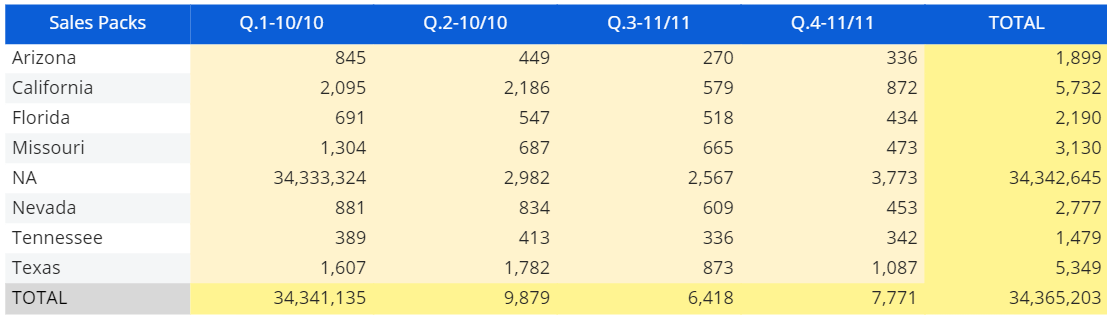
When data entry is enabled on a Cube, the background of totals cells turns yellow while the background of values cells turns ivory (unless otherwise formatted), as in the following example:
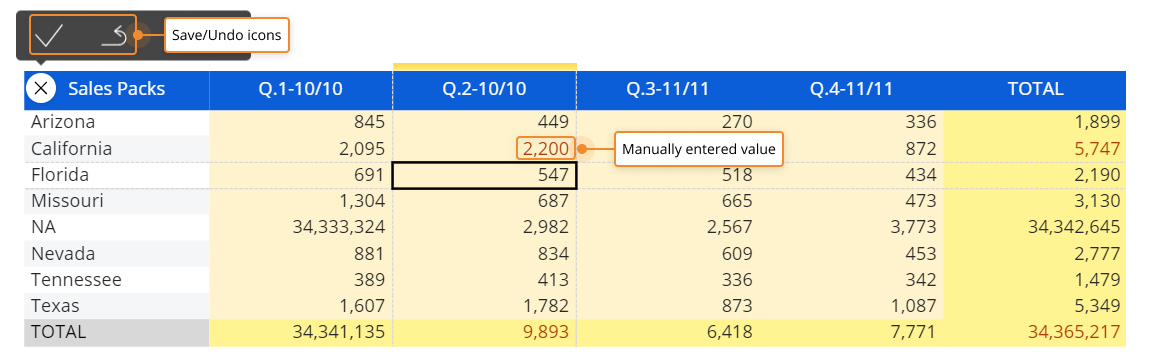
To perform a data entry action, double-click on a cell to enter data (either by typing a value, by uploading a file or a picture, by picking a date from a date picker and so on).
If Save/Undo mode is enabled on the Screen, after you have entered a value press the save icon at the top left of the Data View to actually save the value in the Cube. To do this, you can also press the F9 key on your keyboard.
The undo arrow icon allows to restore the last saved values (i.e. it discards all unsaved changes).
Unsaved values and totals that depend on those values are shown in red. When you press the save icon, their text color will change to match the text color of previously saved values, indicating that all changes have been saved in the target Cube.
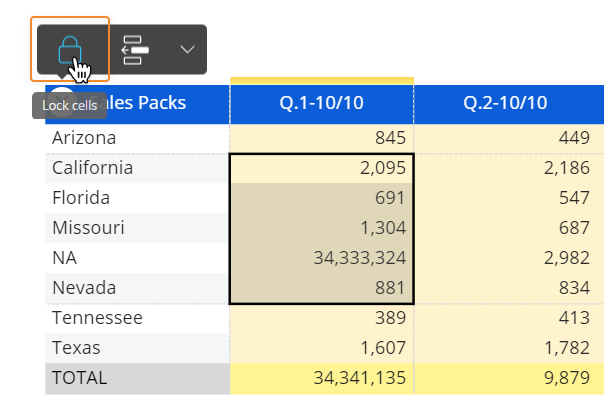
When data entry option is enabled in the Layout, after you have manually entered data in a cell, the contextual menu (sliding toolbar) in the top left corner of the Data View will automatically show the Save/Undo icons (if Save/Undo mode is enabled on the Screen) and the Lock/Unlock icons (see Lock and Spread for more details).
The Contextual menu (sliding toolbar)
When you hover over the Object area, the contextual menu icon (![]() ) appears in the top left corner. Click on it to reveal the contextual menu as a sliding toolbar. You can fully expand it by clicking on the downward facing arrow on the right.
) appears in the top left corner. Click on it to reveal the contextual menu as a sliding toolbar. You can fully expand it by clicking on the downward facing arrow on the right.
The contextual menu includes the following icons by default (unless otherwise configured):
- The Layout icon
 . Opens the Layout editor
 - XLSX icon
 . Exports data in a MS Excel Worksheet as a flattened table
 - Export printable report
 . Export the map as a PDF file or a PNG file (image)
 - Comment icon
 . Displays any comment attached to the map (if any). Depending on the comment configuration, the icon displayed can be a balloon icon, a question mark icon or an alert icon
 - Analysis icon
 . Activates the automatic analysis using Board's Cognitive space technology: this feature generates an audio and textual description of your map.
Learn more about: