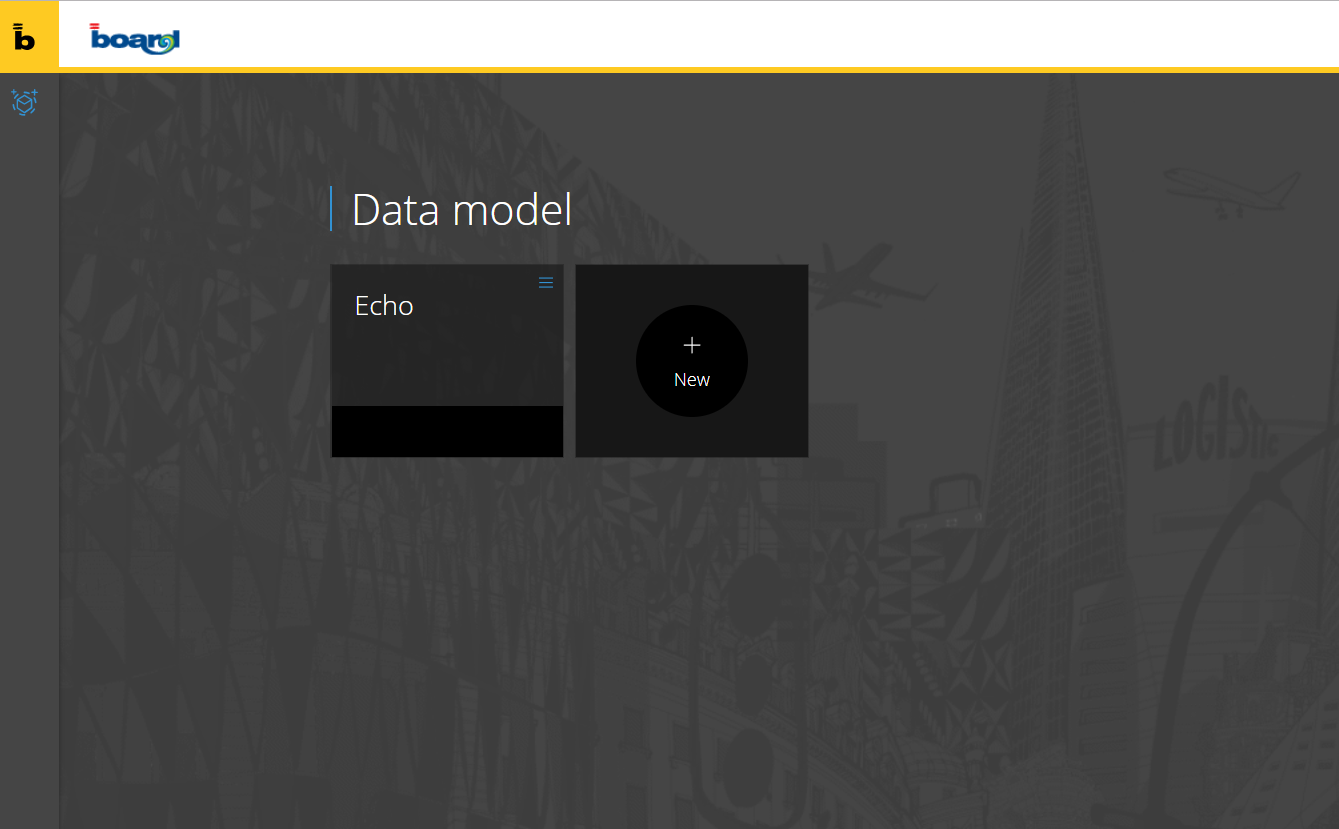
The Web Data Model Designer is now available on the Board Web Client. The BOARD databases can now be developed using a web browser. The Data Model space is identified with the yellow color and it is accessible for the Developers from the BOARD menu on the toolbar (top left corner of the web page).
The available Data Models are displayed with tiles. On Mouse overing any tile the user can access to several Data Model functions:
Backup Data Model
Edit Data Model
Rename Data Model
Restore Data Model
Delete Data Model
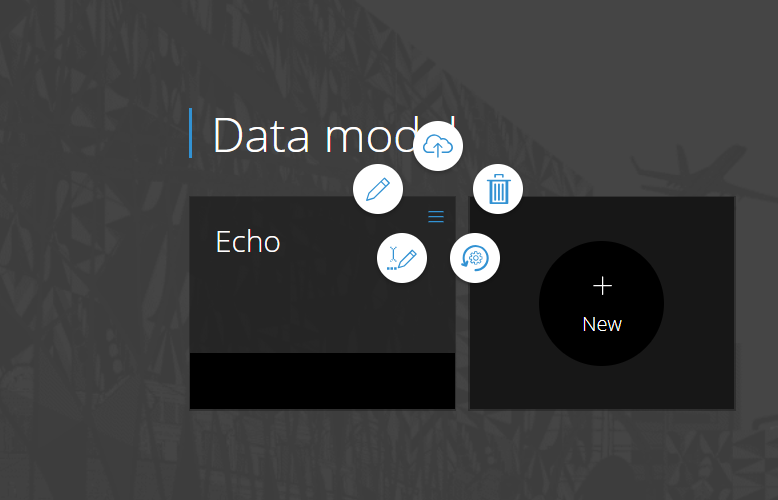
For each of these options there are warning pop-up messages that alert or guide the users through it.
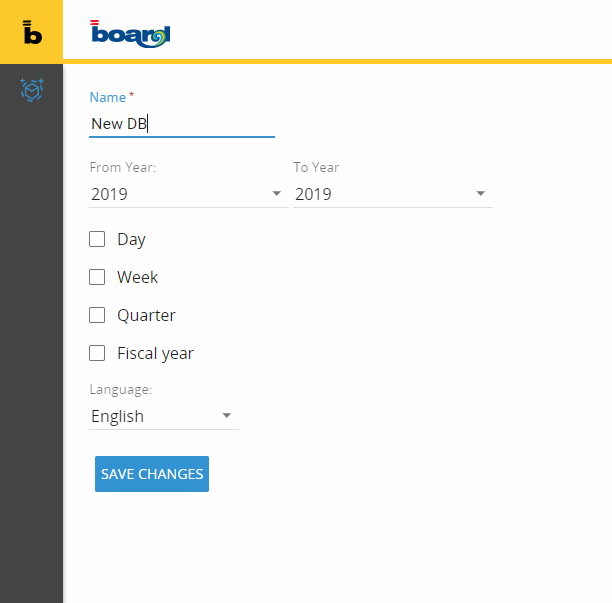
To create a new Data Model from scratch the user can click on the + New icon. The icon pops-up the 'create data model wizard' that ask name, time range and language. Clicking save changes confirms the data model creation and lands into the data model designer features.
Once clicked on one of the Data Model, the features accessible from the designer space are:
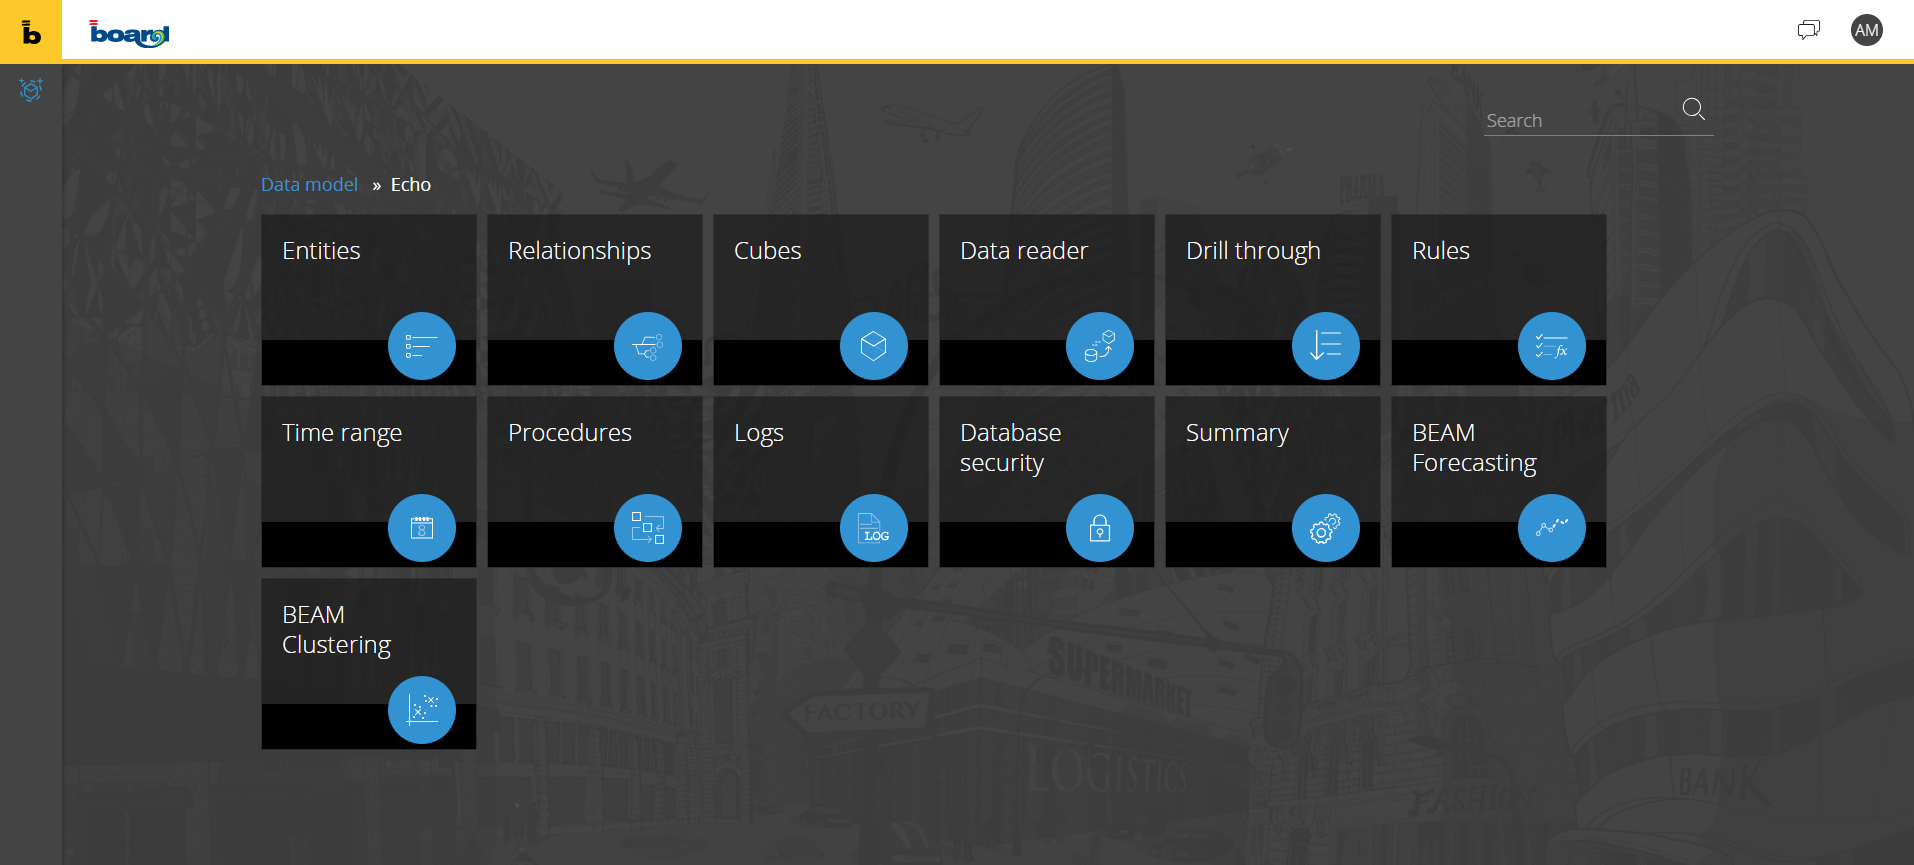
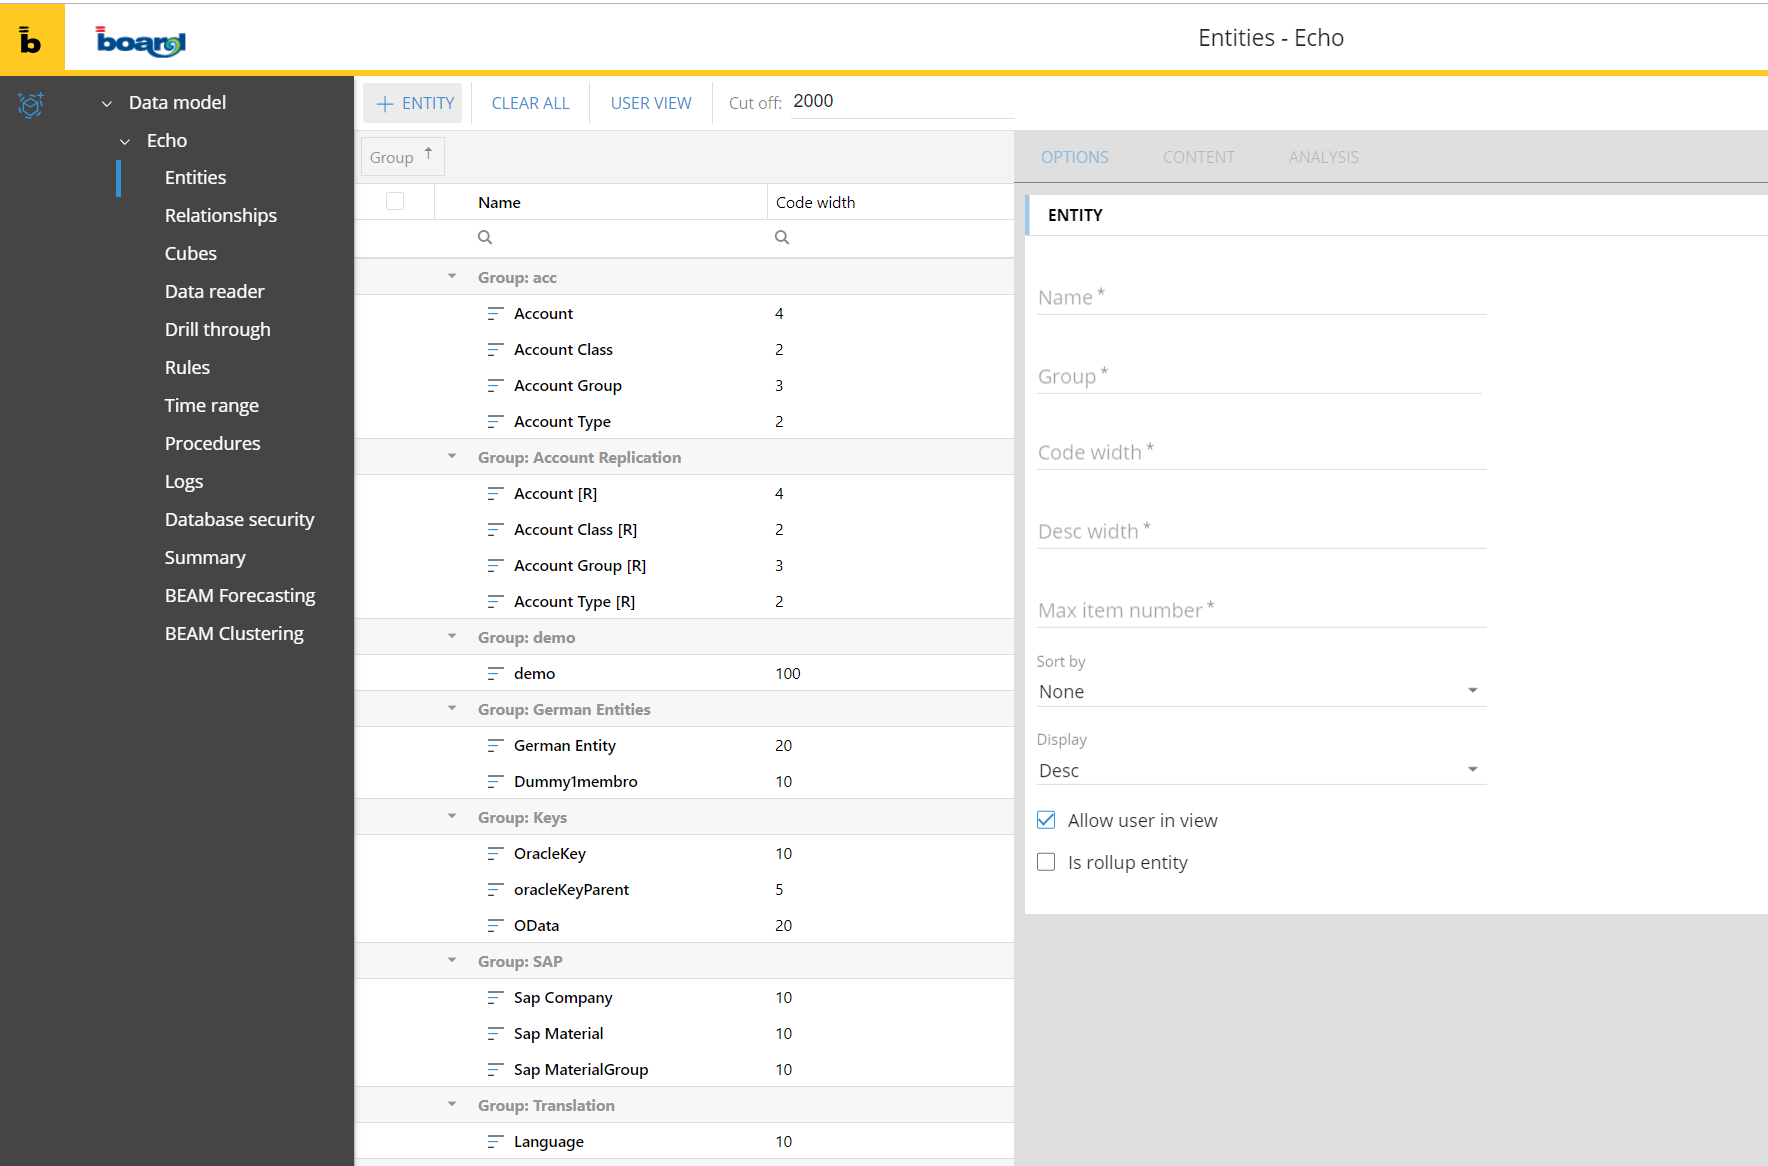
The navigation on the different Data Model features is also available from the navigation sitemap on the left side of the page.
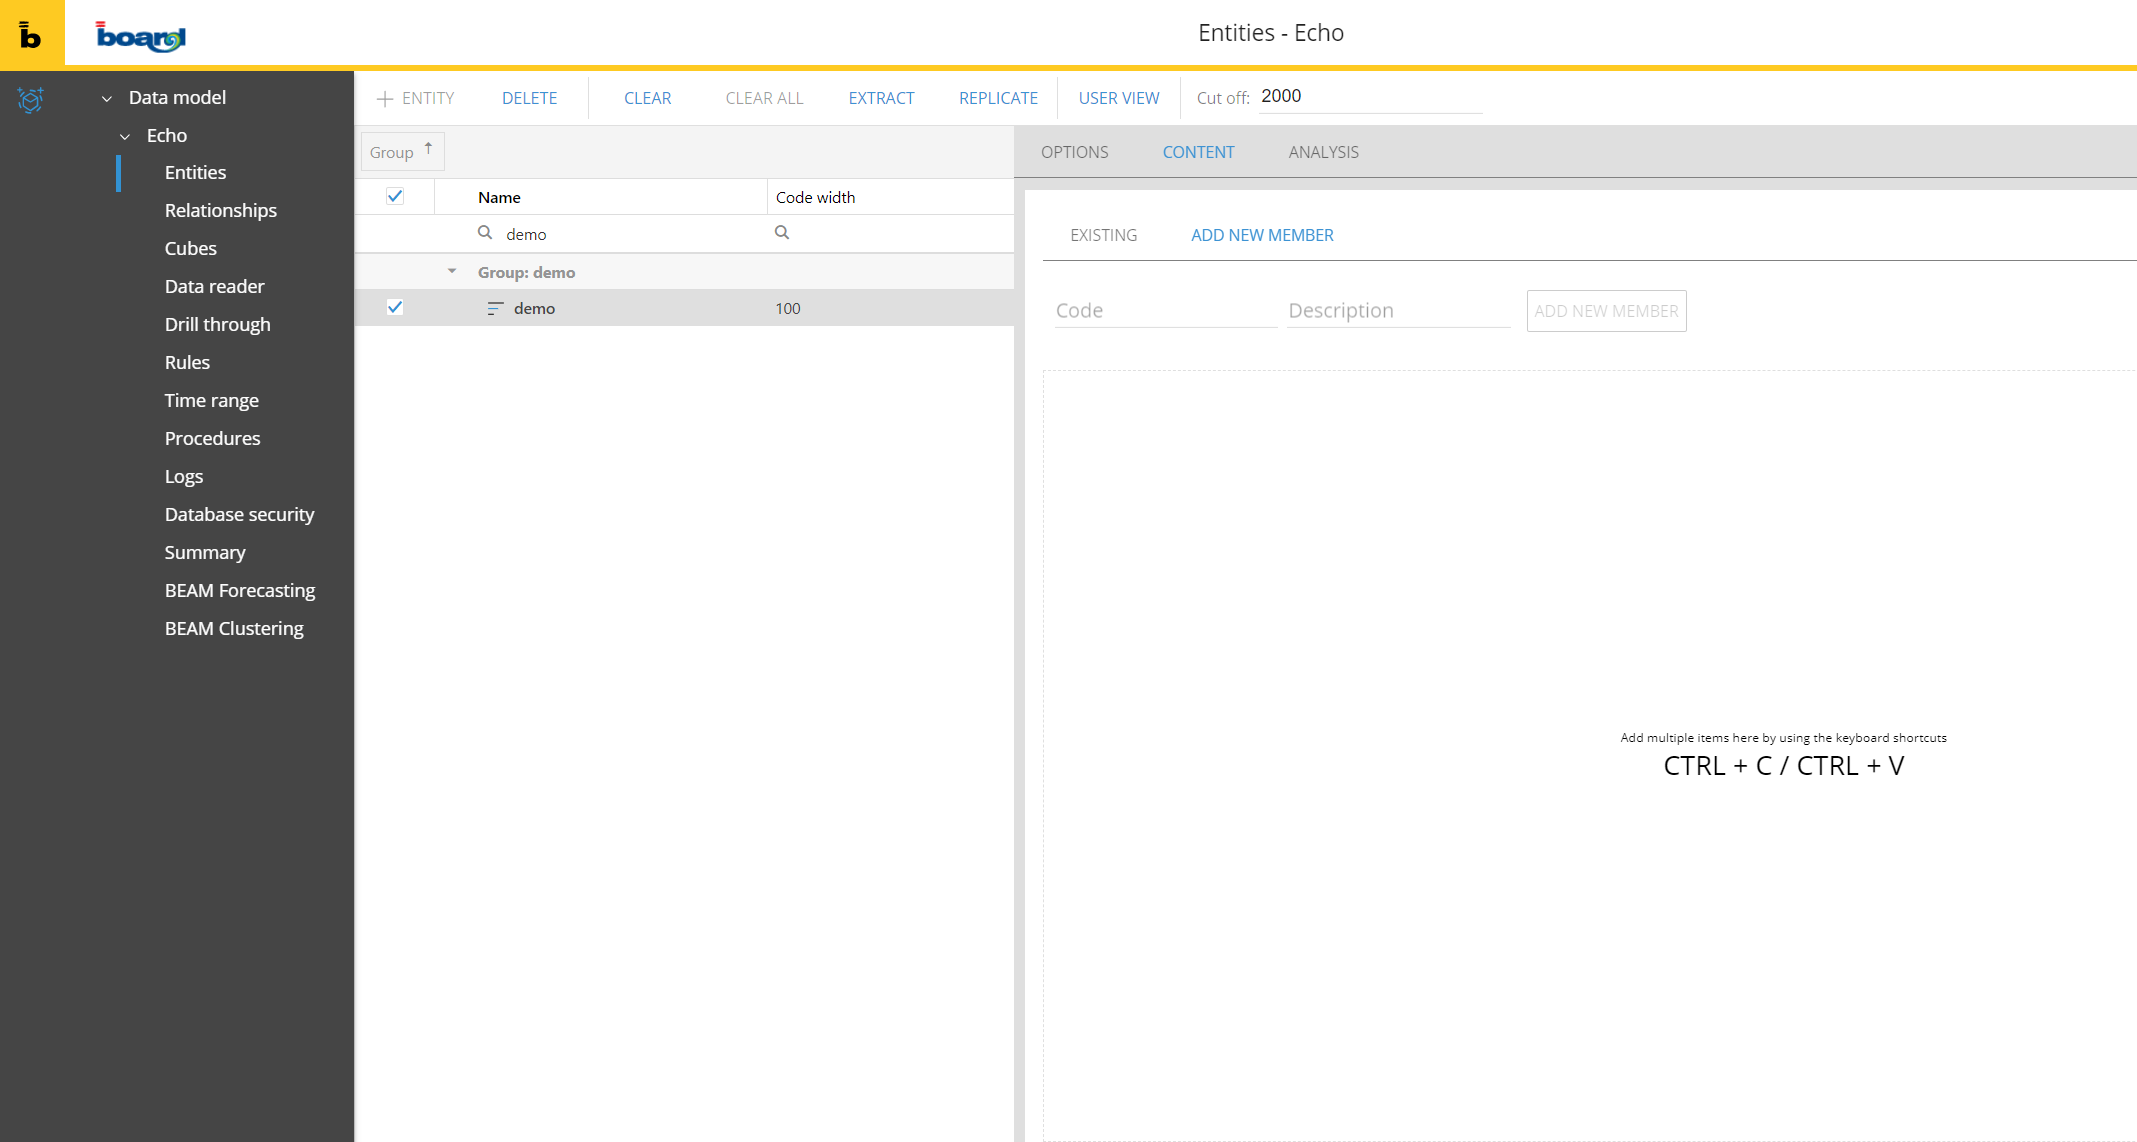
From the Entities Tile the users access to the Entity manager. The new entity manager uses a simplified grid to show all the available entities of the data model. Click here to read more about the BOARD E/R model .
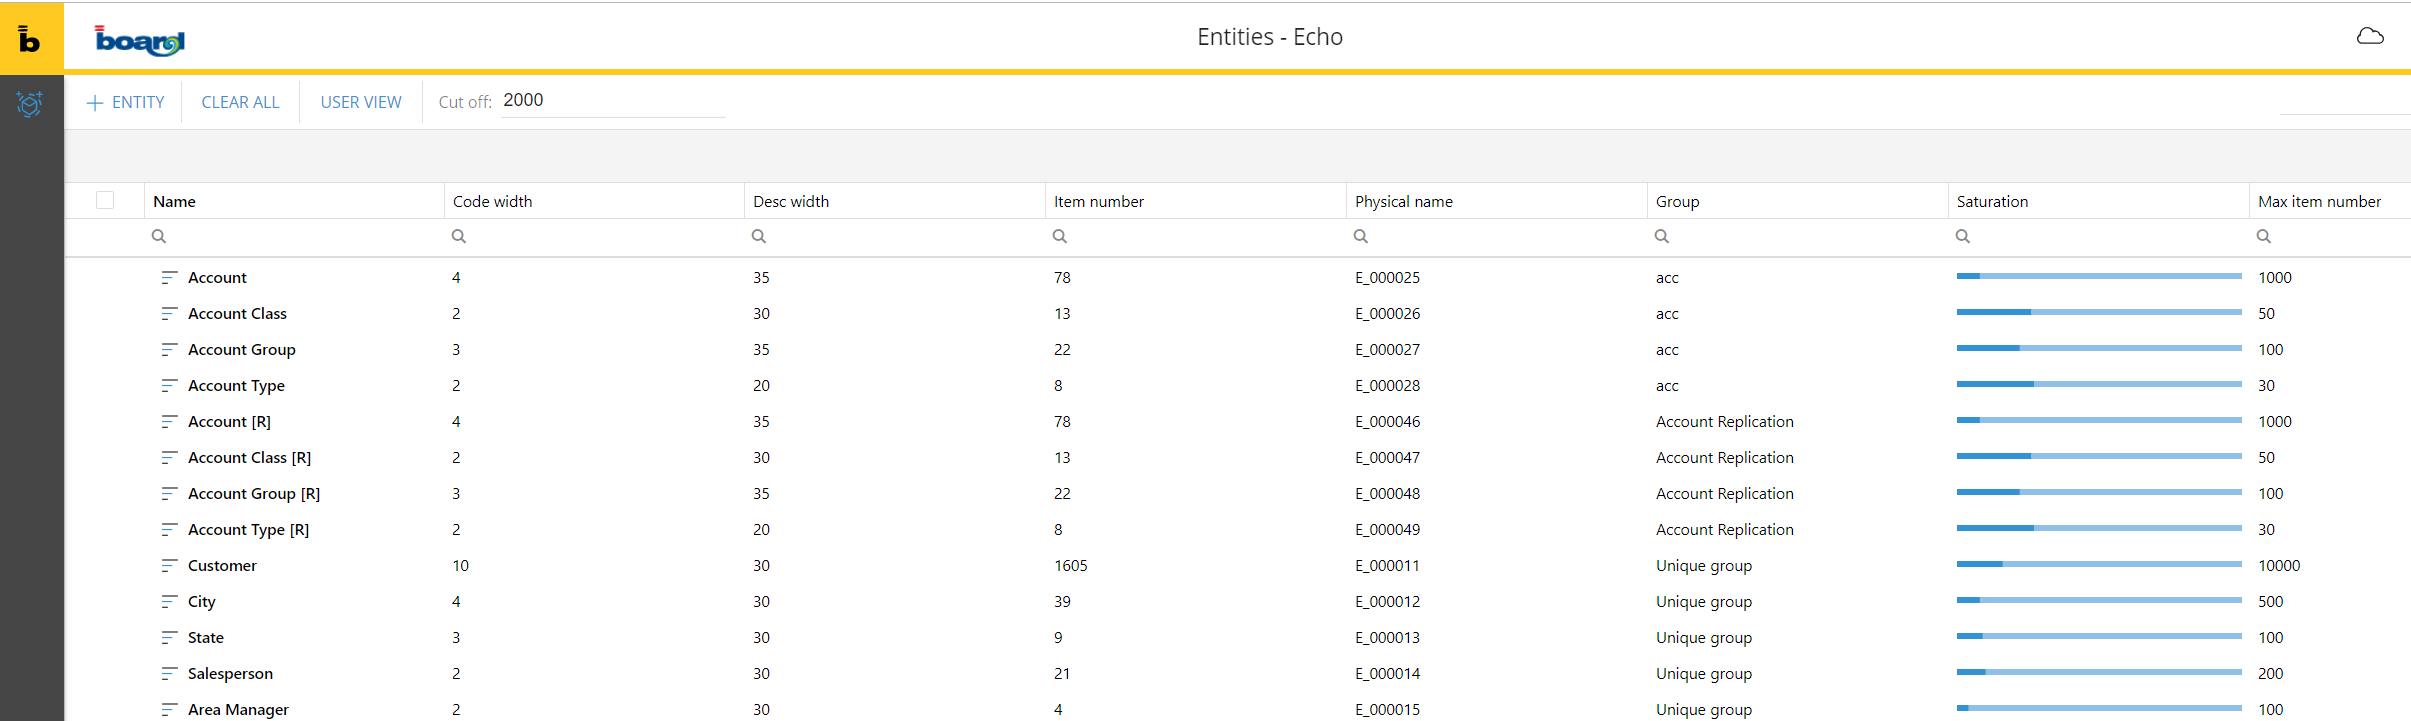
It is possible to sort and filter the columns or group the entities dragging the column headers in the top grey area of the grid as below .
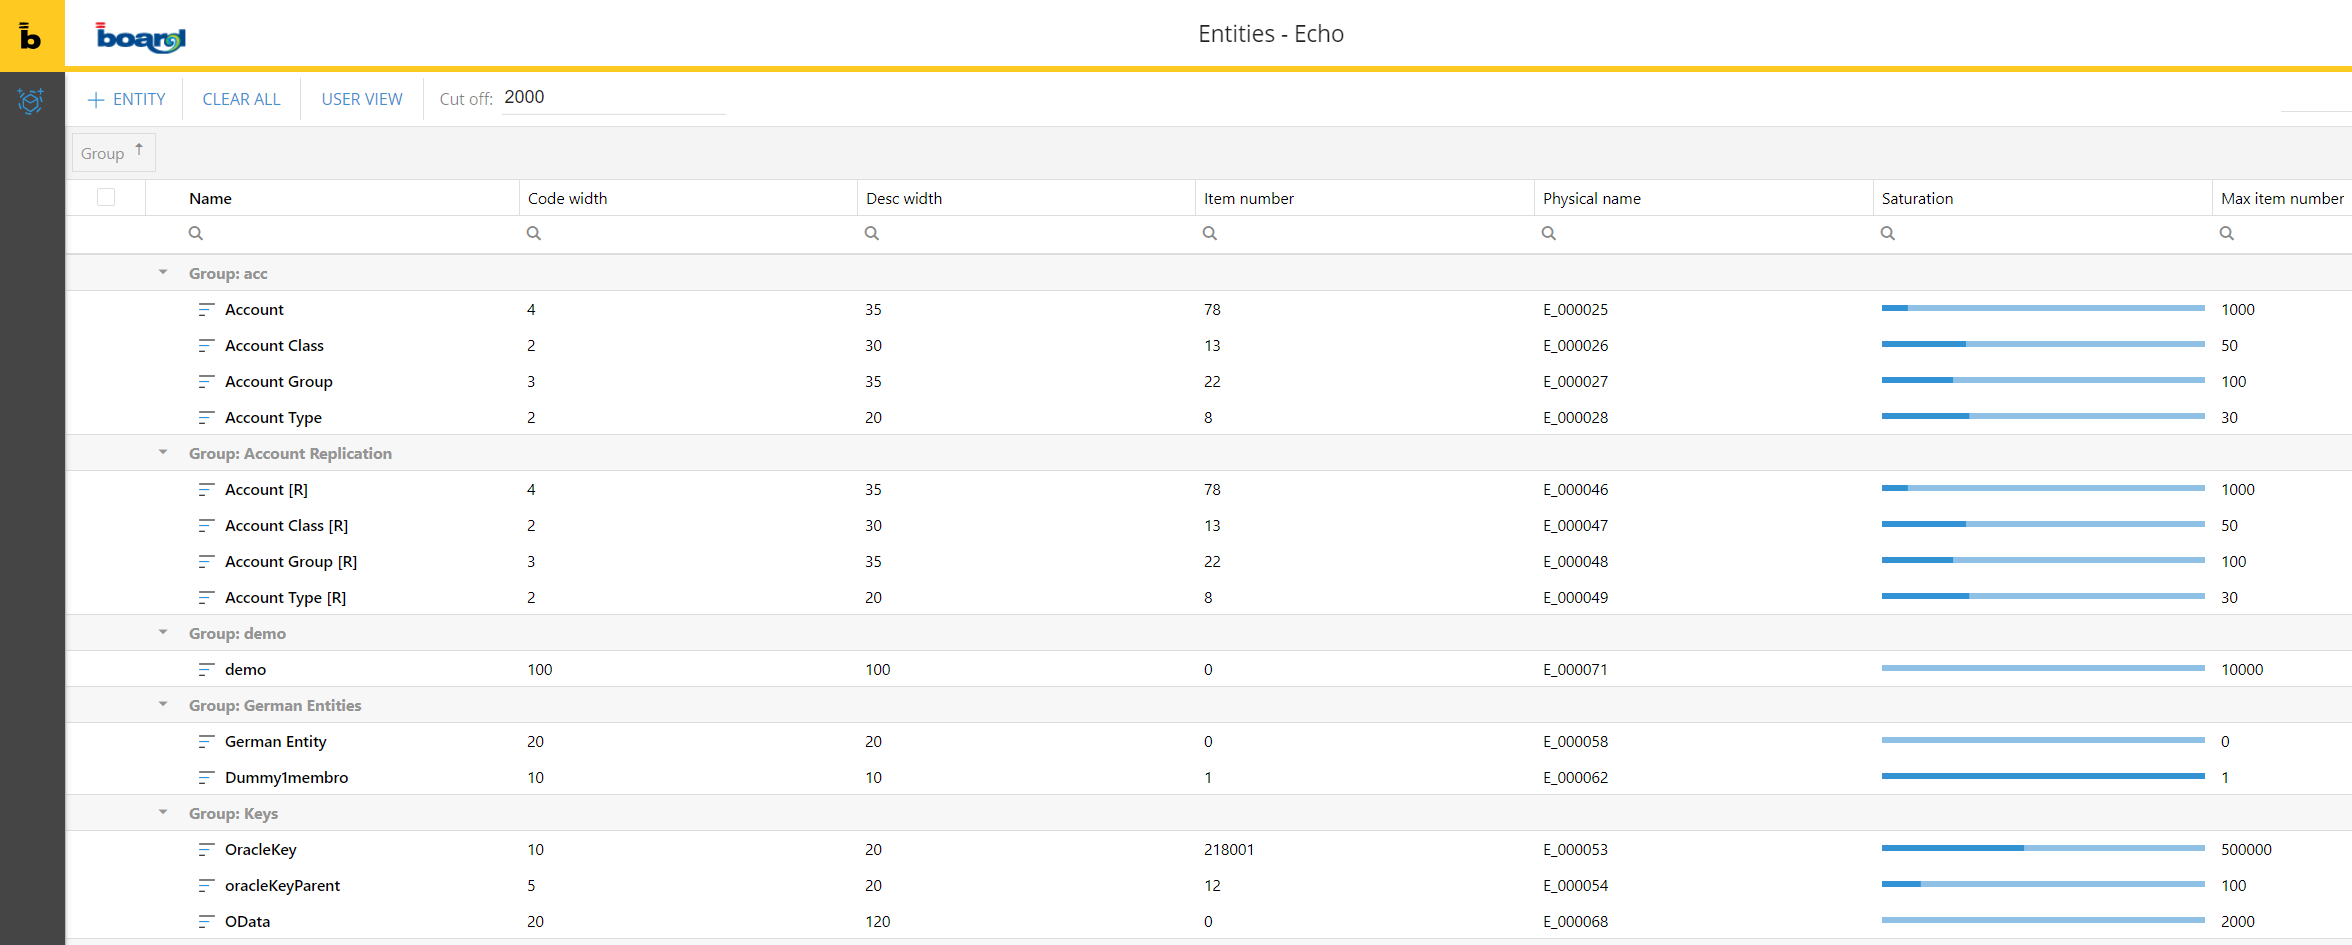
The design tools are available in the most top left corner of the page. These options are: create new entity, clear all entities, user view setup and the entity cut-off definition.
Add New Entity
New entities can be added clicking on the +ENTITY button . The new entity configuration is then available in the right sliding panel :
Important Notice
The add new entity wizard request a save changes confirmation . The content and the analysis tabs are disabled until such confirmation is given.
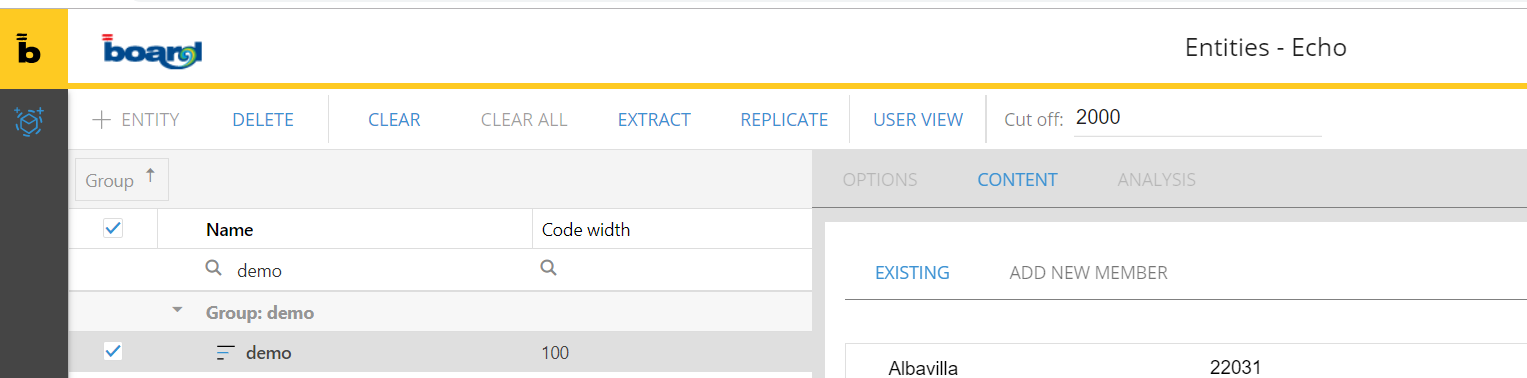
Add new members to an entity
The entity members are available from the Content tab. The content tab is accessible clicking on an existing entity from the entity list. The Content tab is divided in 2 parts: existing and add new members. In the existing part you can see the actual content of the entity, from the add new member you can add new entity items. It is also possible to use CTRL+C/CTRL+V shortcuts to add multiple members from an external file (like a csv) on a single action.
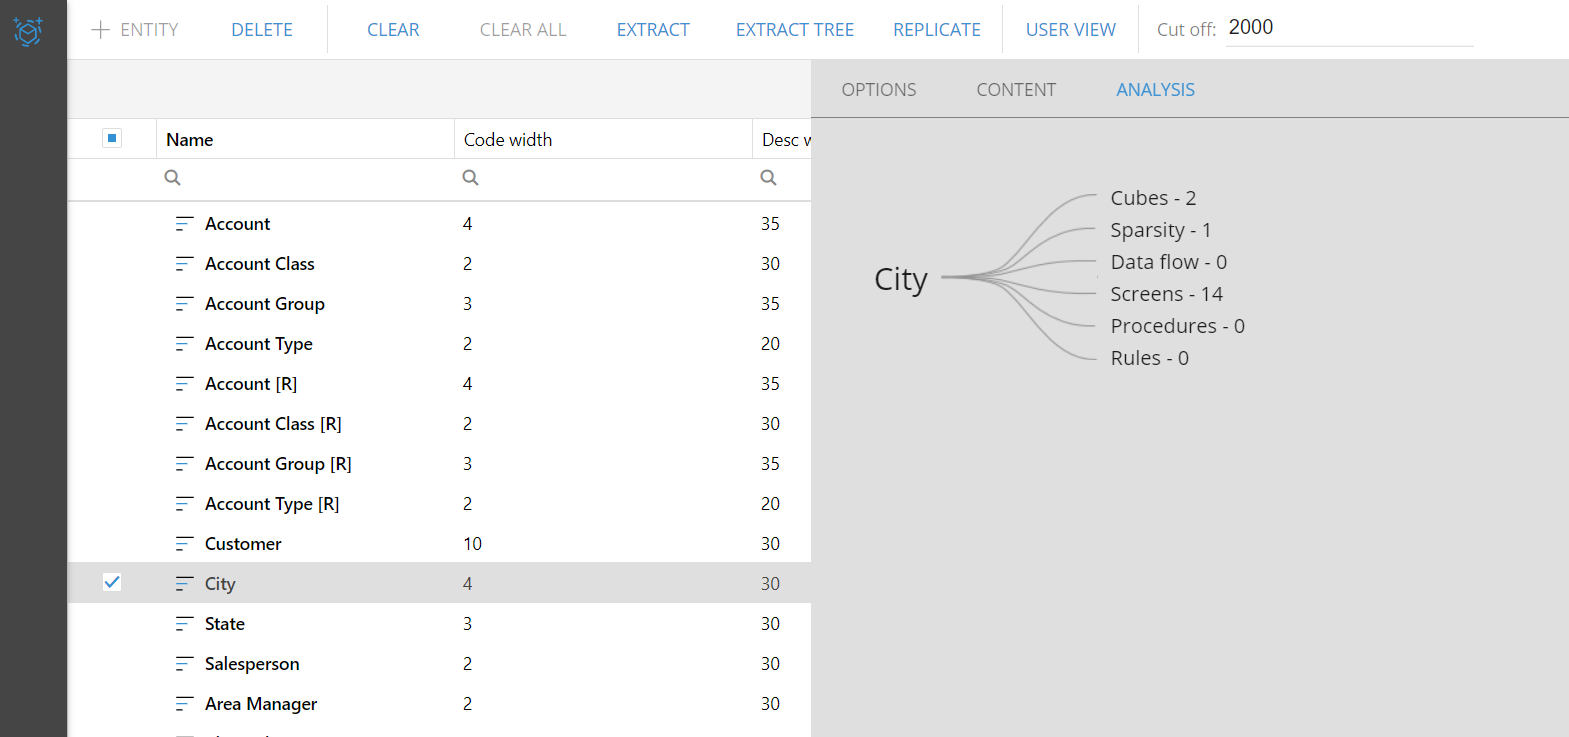
Entity Analysis
From the analysis tab the user can access to the impact analysis feature. The impact analysis shows where the entity is referenced in the Data Model. It is possible to check if the entity is currently used in any cube, sparsity, data-flow, screen, procedure and rule.
Toolbar actions
When an entity is selected from the entity list, the available actions are prompted in the toolbar of the entity manager as belowe. The available actions are: delete, clear,, extract, replicate and user view. It is also possible to select multiple entities to perform some of those actions together.
Clicking the Relationships Tile the users access to the Relationships manager. In this section are shown all the existing hierarchies defined in the data model.Click HERE. to read more about the BOARD E/R model .
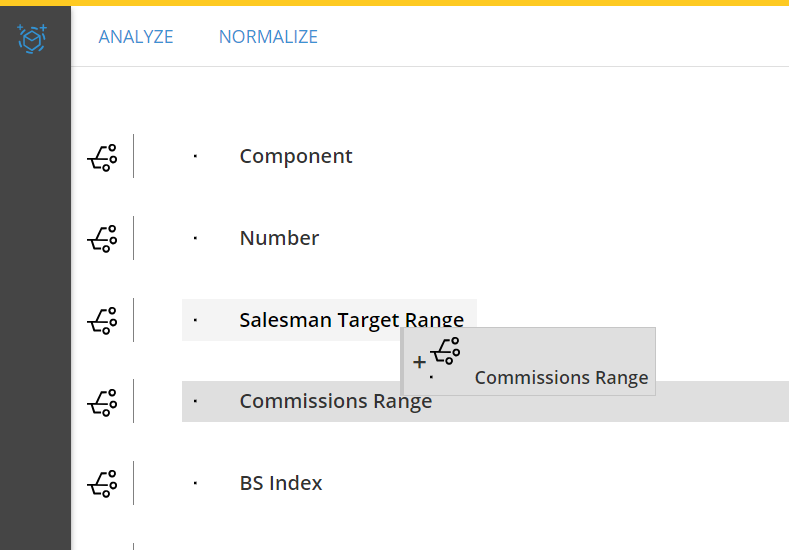
Users can create a relationship by dragging and dropping the entities of the Data Model.
Entering in the Relationships manager, the list of the entities available in the Data Model is shown.
Then it is possible to drag an entity over another one, to create a new relationship. The dragged entity is now a parent entity. This mechanism is iterated. A PArent of a Parent ia automatically a Parent (of second level) of the Hierarchy Foot.
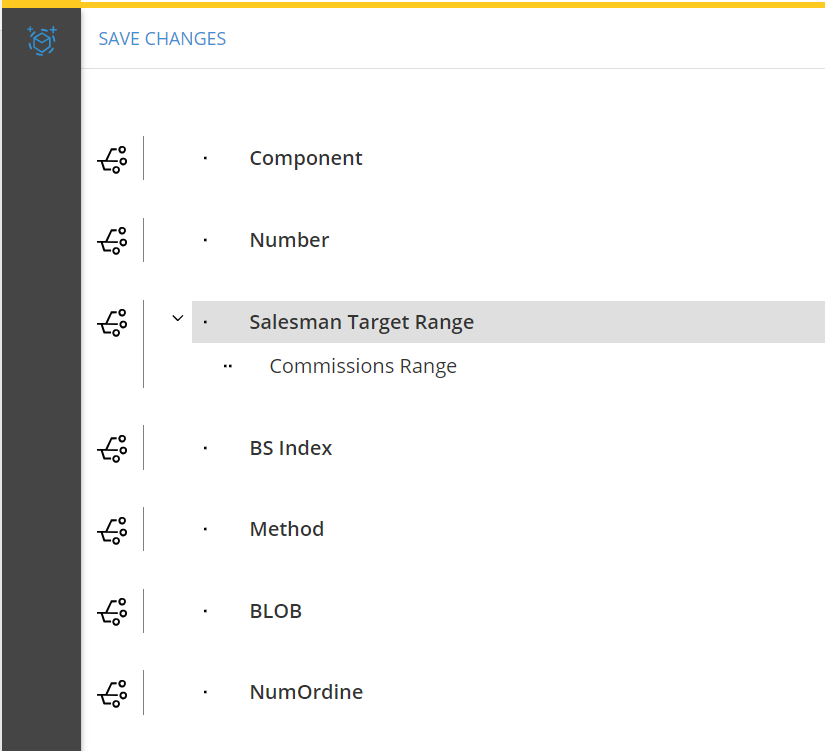
To Save click the Save Changes button in the top left corner of the web page.
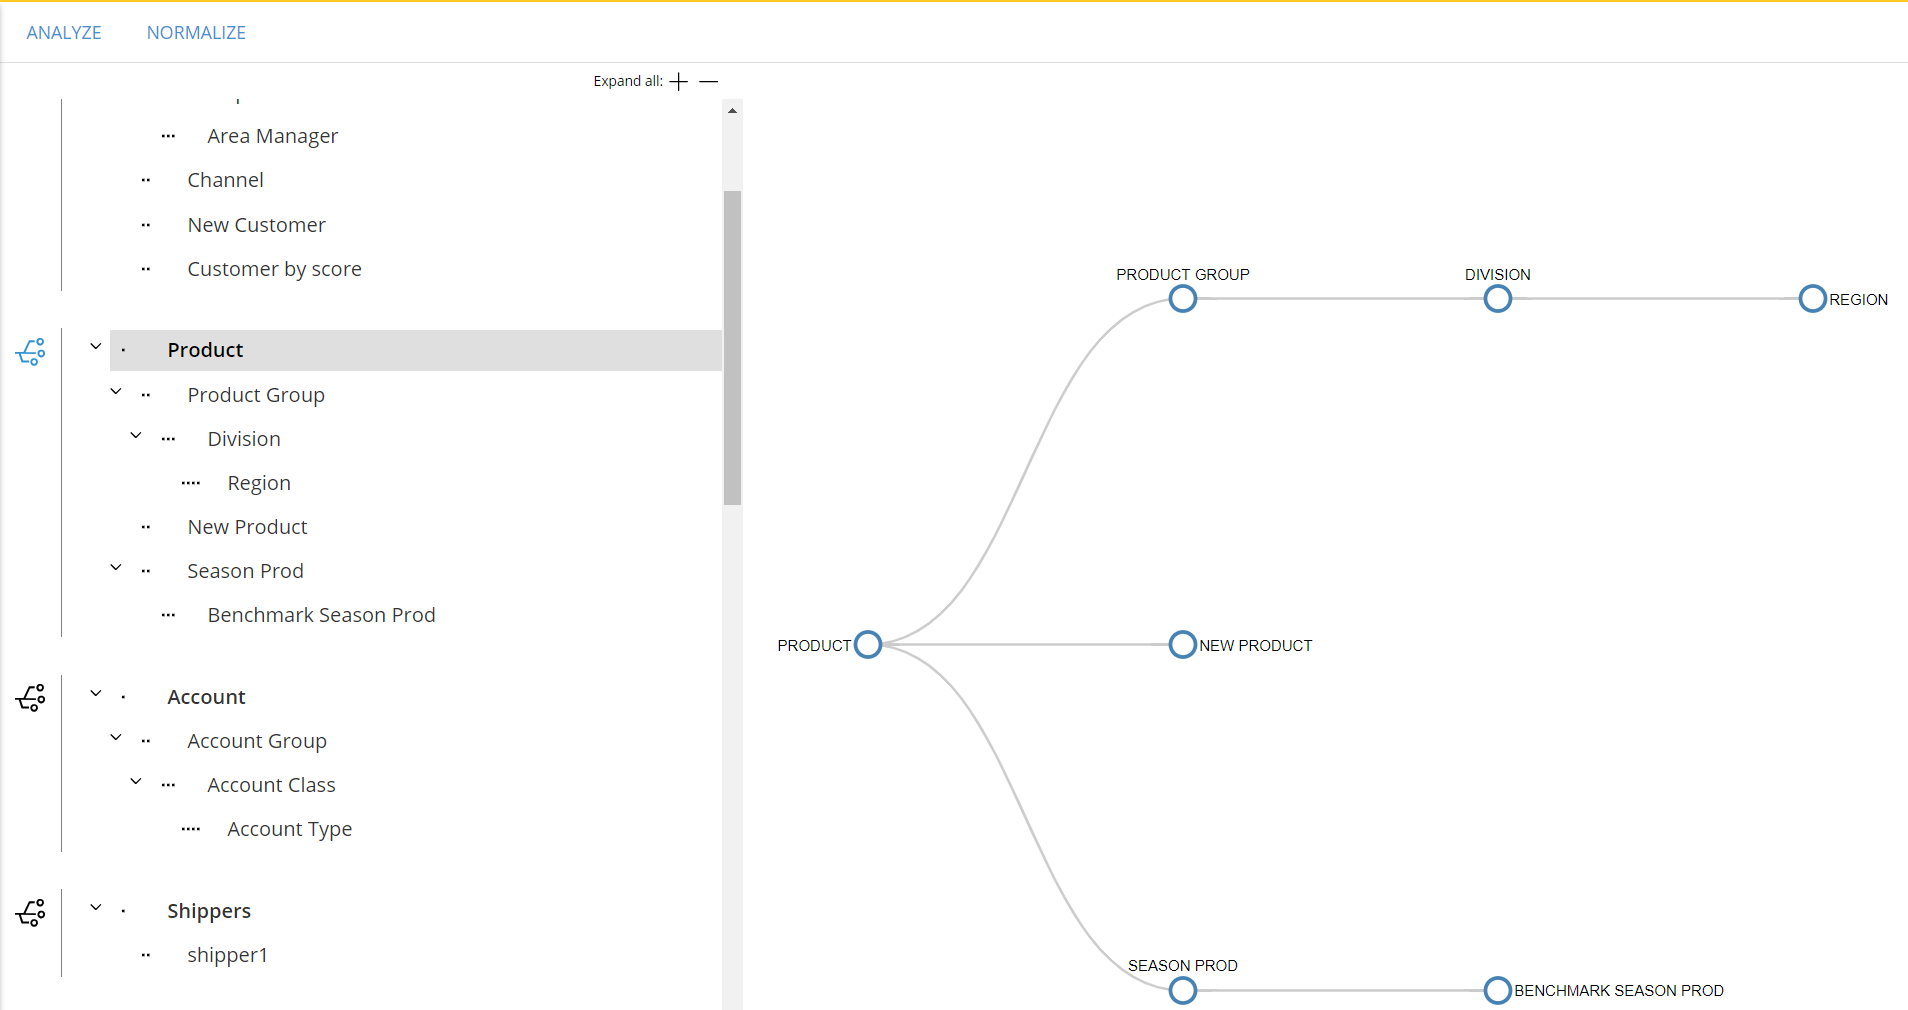
Graphical View
It is also possible to access to a graphical representation of the hierarchies. The graphical view is available from the Relationships manager, clicking on the graphical view icon close to the leaf-level entity. The graphical view will be displayed on the right side of the screen.
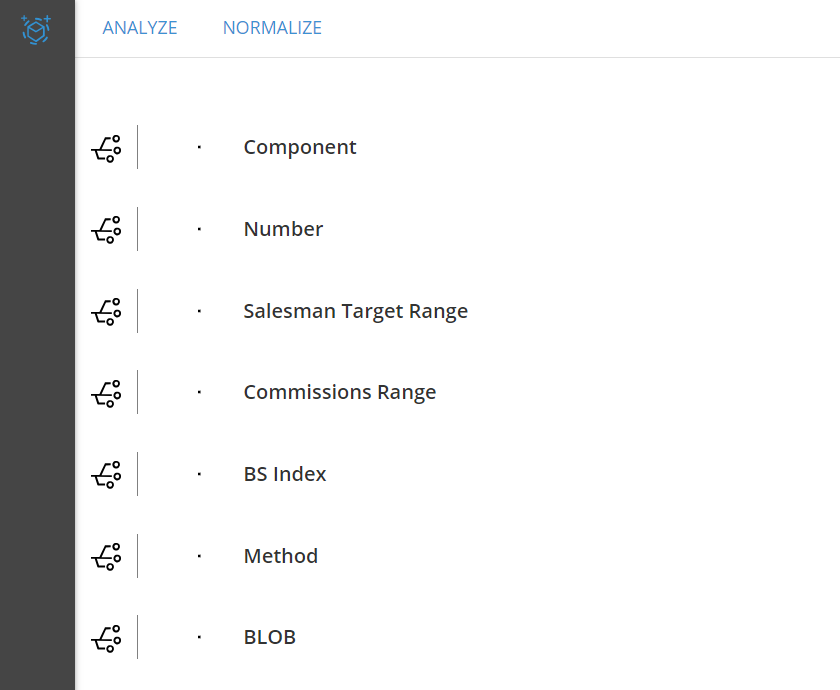
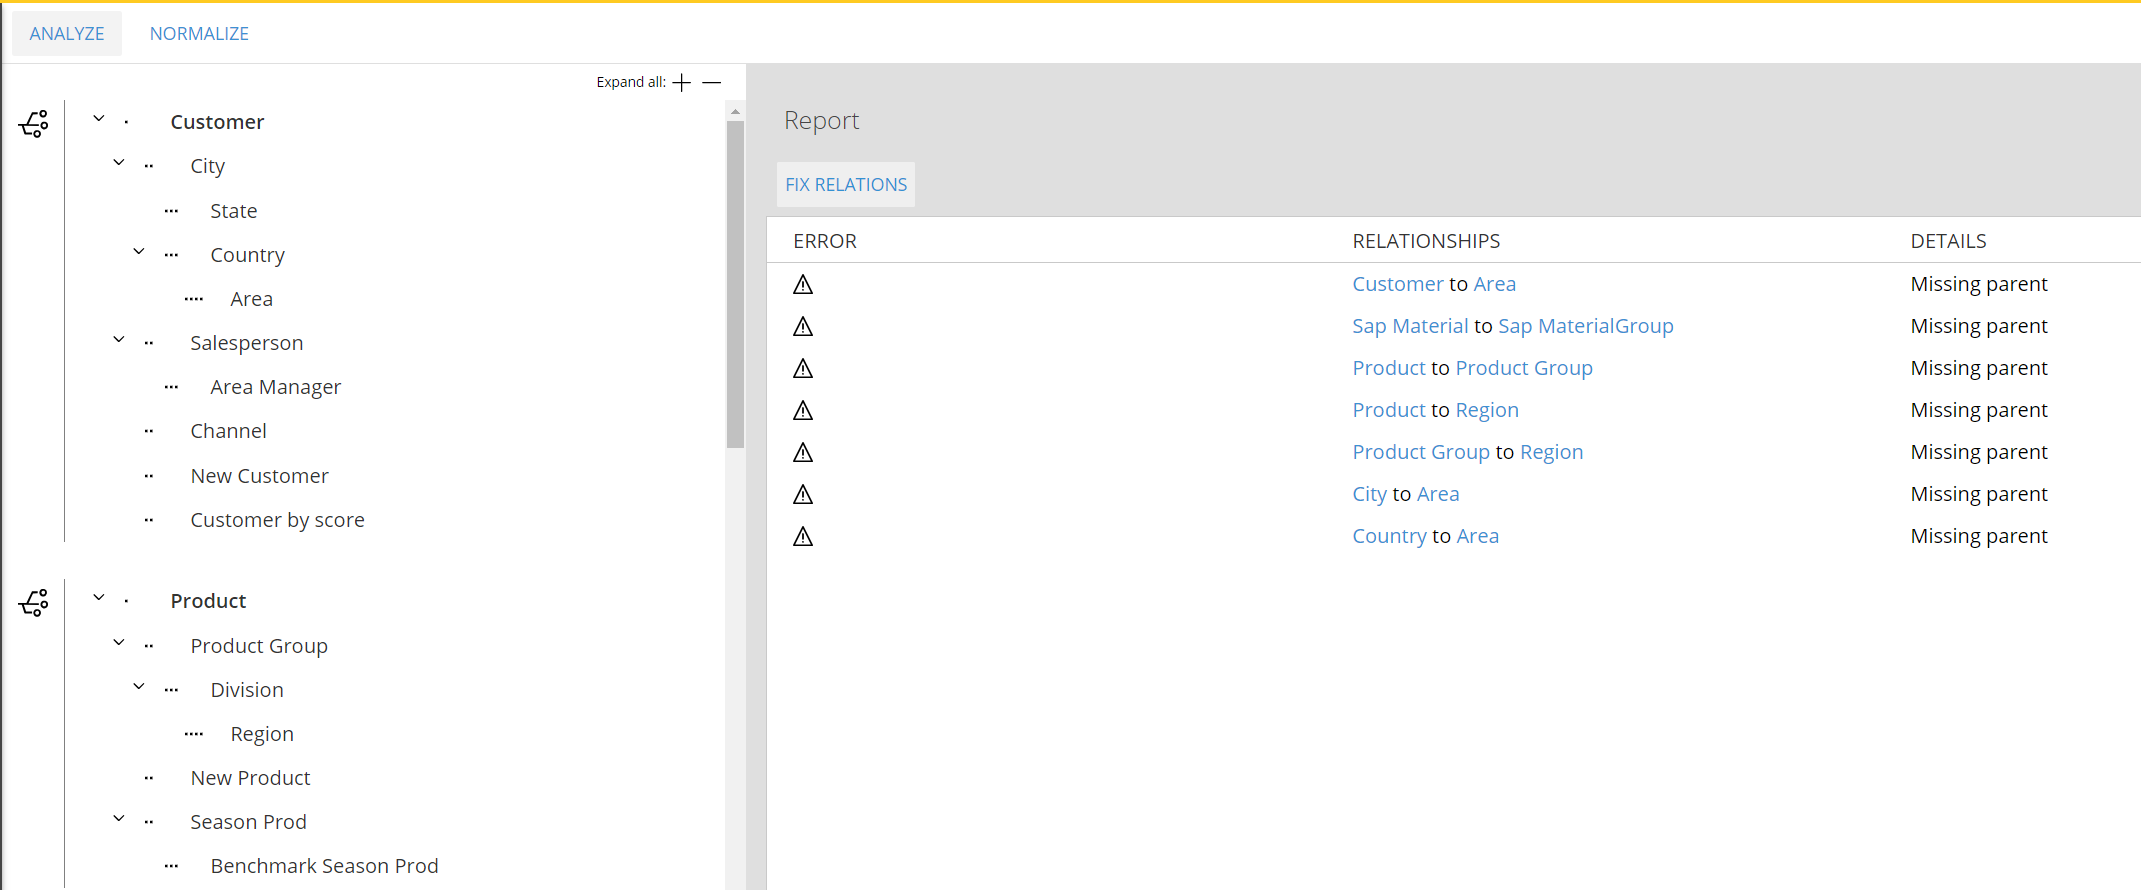
Analyze and Normalize
The Analyze and the Normalize actions are available in the top grey area of the Relationships manager. Clicking the analyze button it shows, on the right side of the web page, all the orphans. These latter can be manually fixed selecting the child entity in the left sliding panel, the parent in the drop down list and clicking ont he missing members.
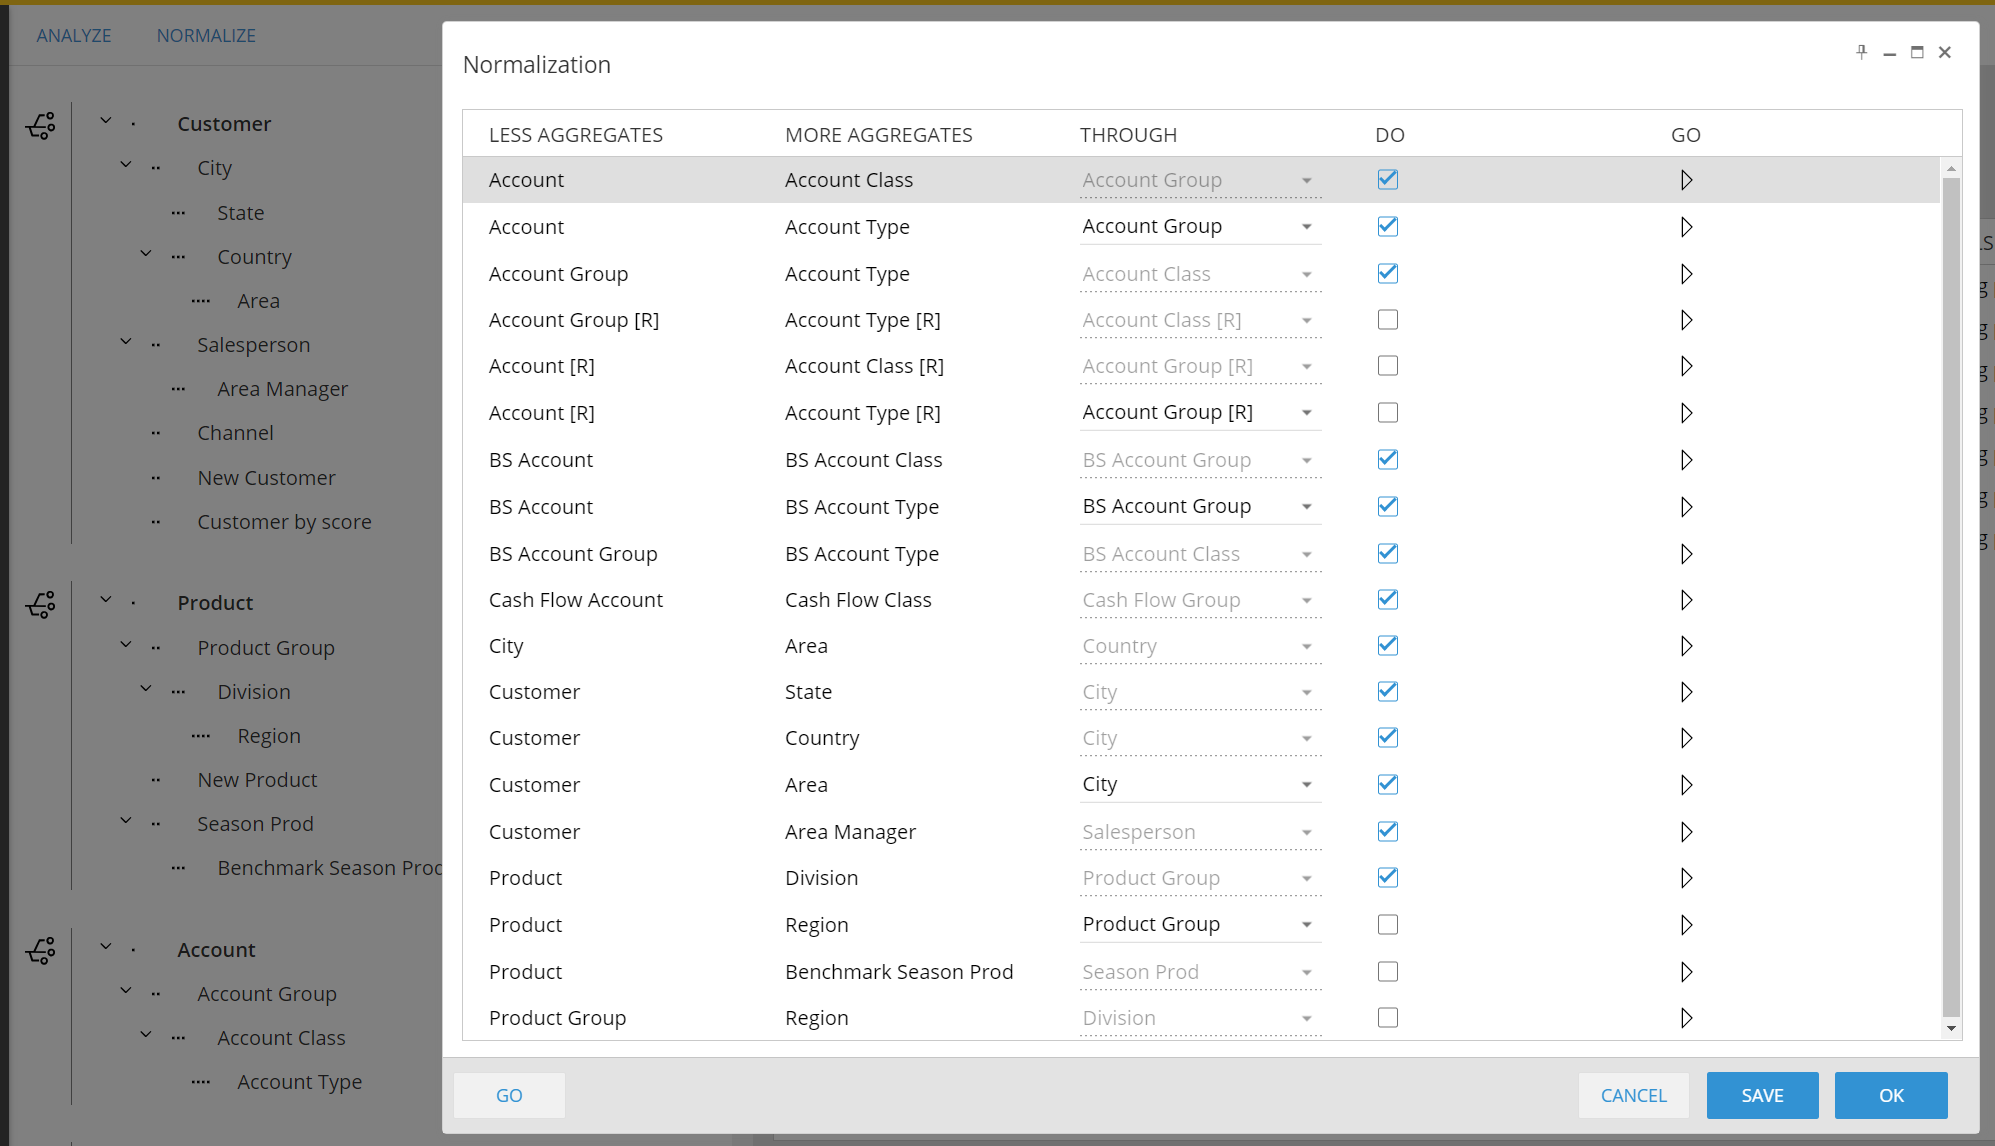
Clicking on the Normalize button you see all the potential normalizing actions you can take. Run those you need to execute clicking on the Go Icon. Ticking the Do check-box and save enables the automatical execution of such normalizations when the normalize action is invoked as a procedure step.
Clicking the Cubes Tile the users access to the Cubes manager. You see all the existing cubes in the data model. If you want to read more about BOARD info- Cubes click HERE.
The cubes workspace share the same facilities of entity's . it is possible to sort and filter the available columns. Additional actions are , clear all and user view.
The extract, verify and align actions are available when a cube is selected in the right side under the cube properties.
Create New Cube
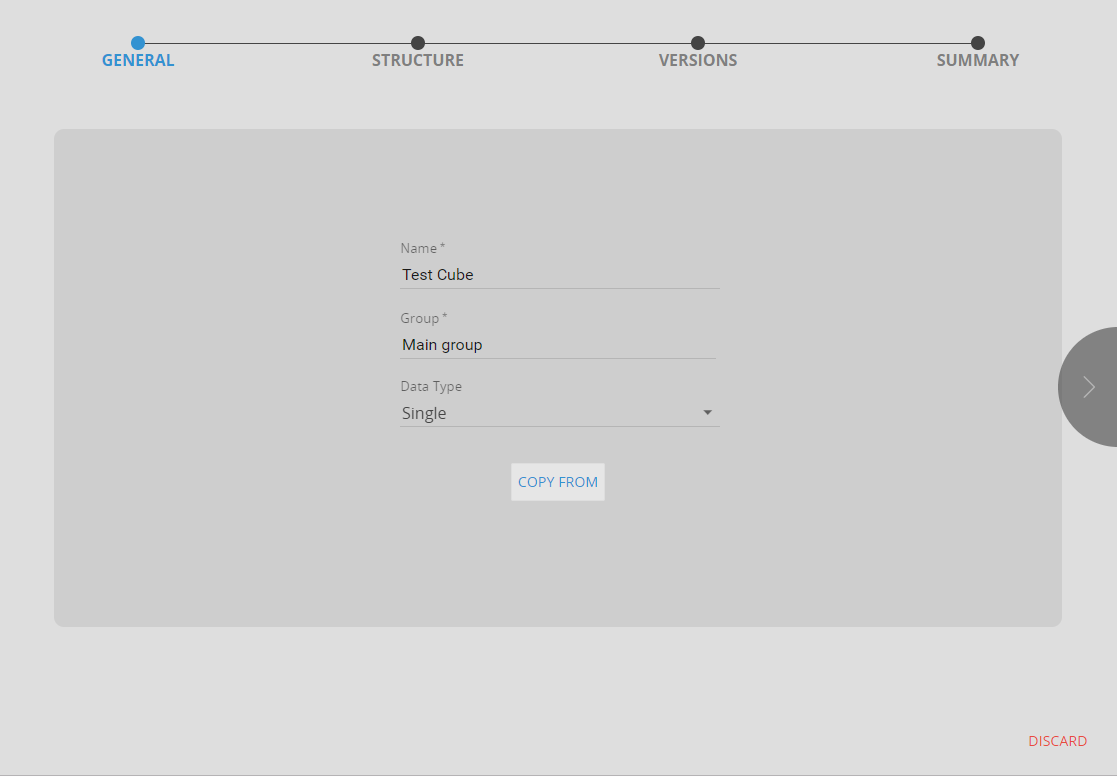
New cubes can be created clicking the +CUBE button . The button opens a wizard in the right sliding panel with 4 steps.
int he first step Name the new cube, assigns a group, and the data type .
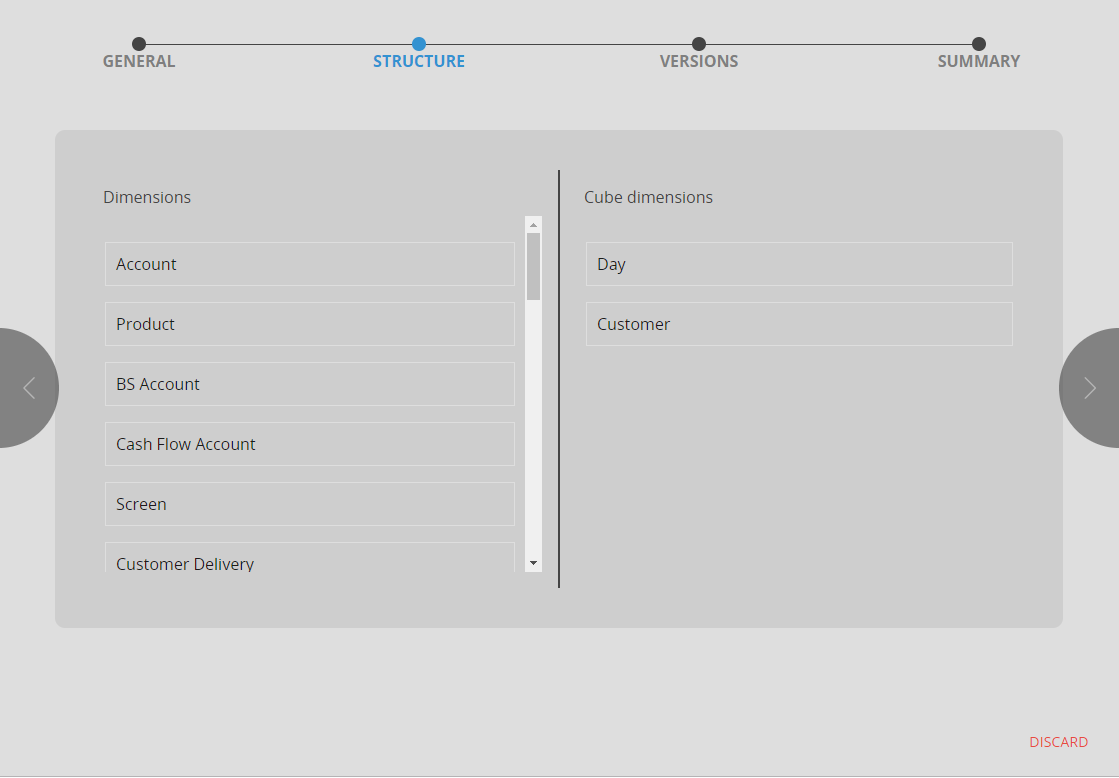
In the second step defines the dimensions of the cube versions dragging the Hierarchies it from the left to the right side of the workspace.
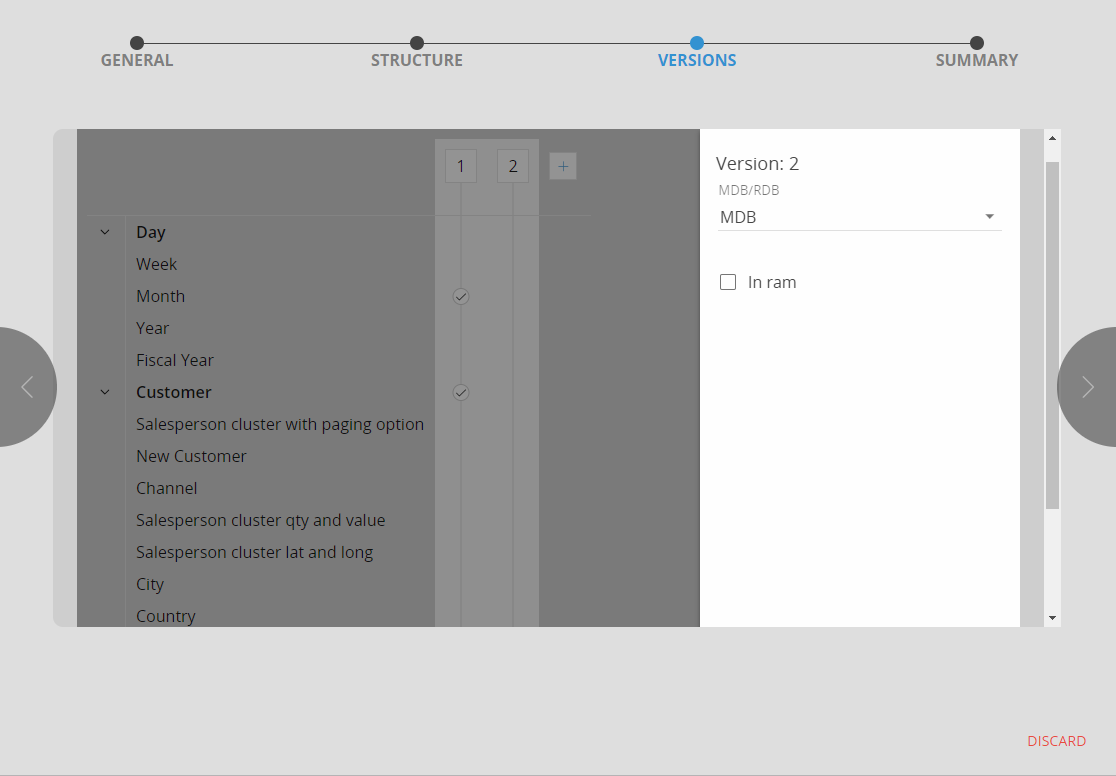
In the third step create as many versions as you need selecting for each, the dimensions of the version. New versions can be added clicking the + button. Change the nature (MOLAP vs ROLAP) of the version clicking on the version Number.
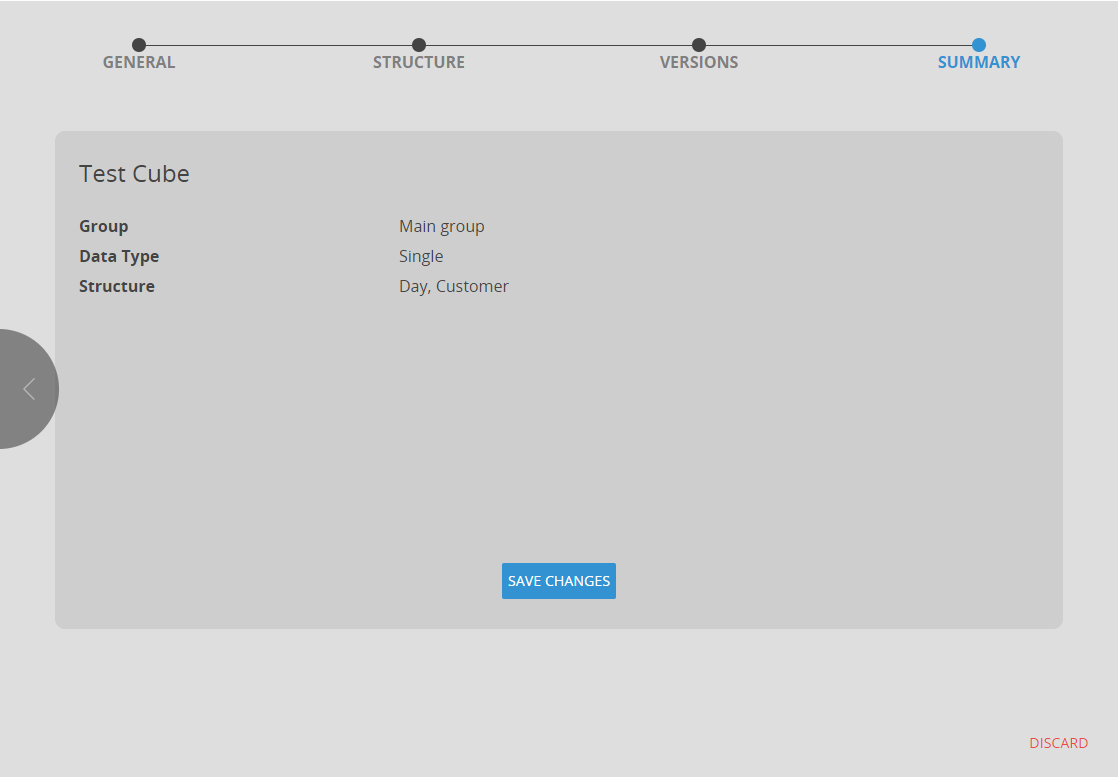
Last step, summarizes, the info-cube attributes and prompts the Save Changes button.
The Data readers designer shows the existing data-loading protocols in the Data Model and allows the users to create new reading protocols . Click HERE. to know more about the BOARD Data readers .
The data-reader list can be easily sorted and filtered with the new interface, dragging the coulmn header in the top grey area. The columns that are shown can be customized using the Column Chooser button .
How to create a new Data Reader
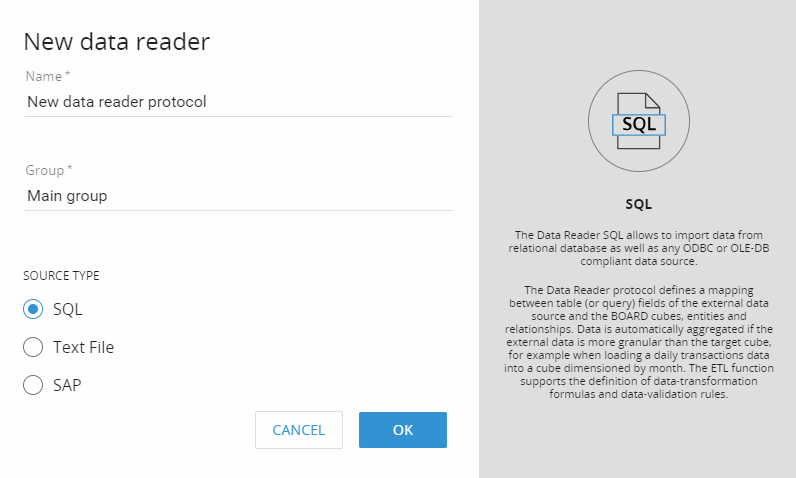
New Data reader protocols can be created clicking on the +DATA READER button . You have then to type the protocol name, the group and the data source type. There are 3 source types available:
SQL
Text File
SAP
A wizard drives the suer through the creation process. There are three main steps:
Source: select a connection protocol or create a new connection.
Mapping: map the RDB tables and the MDB entities and cubes.
ETL: define transformation formulas
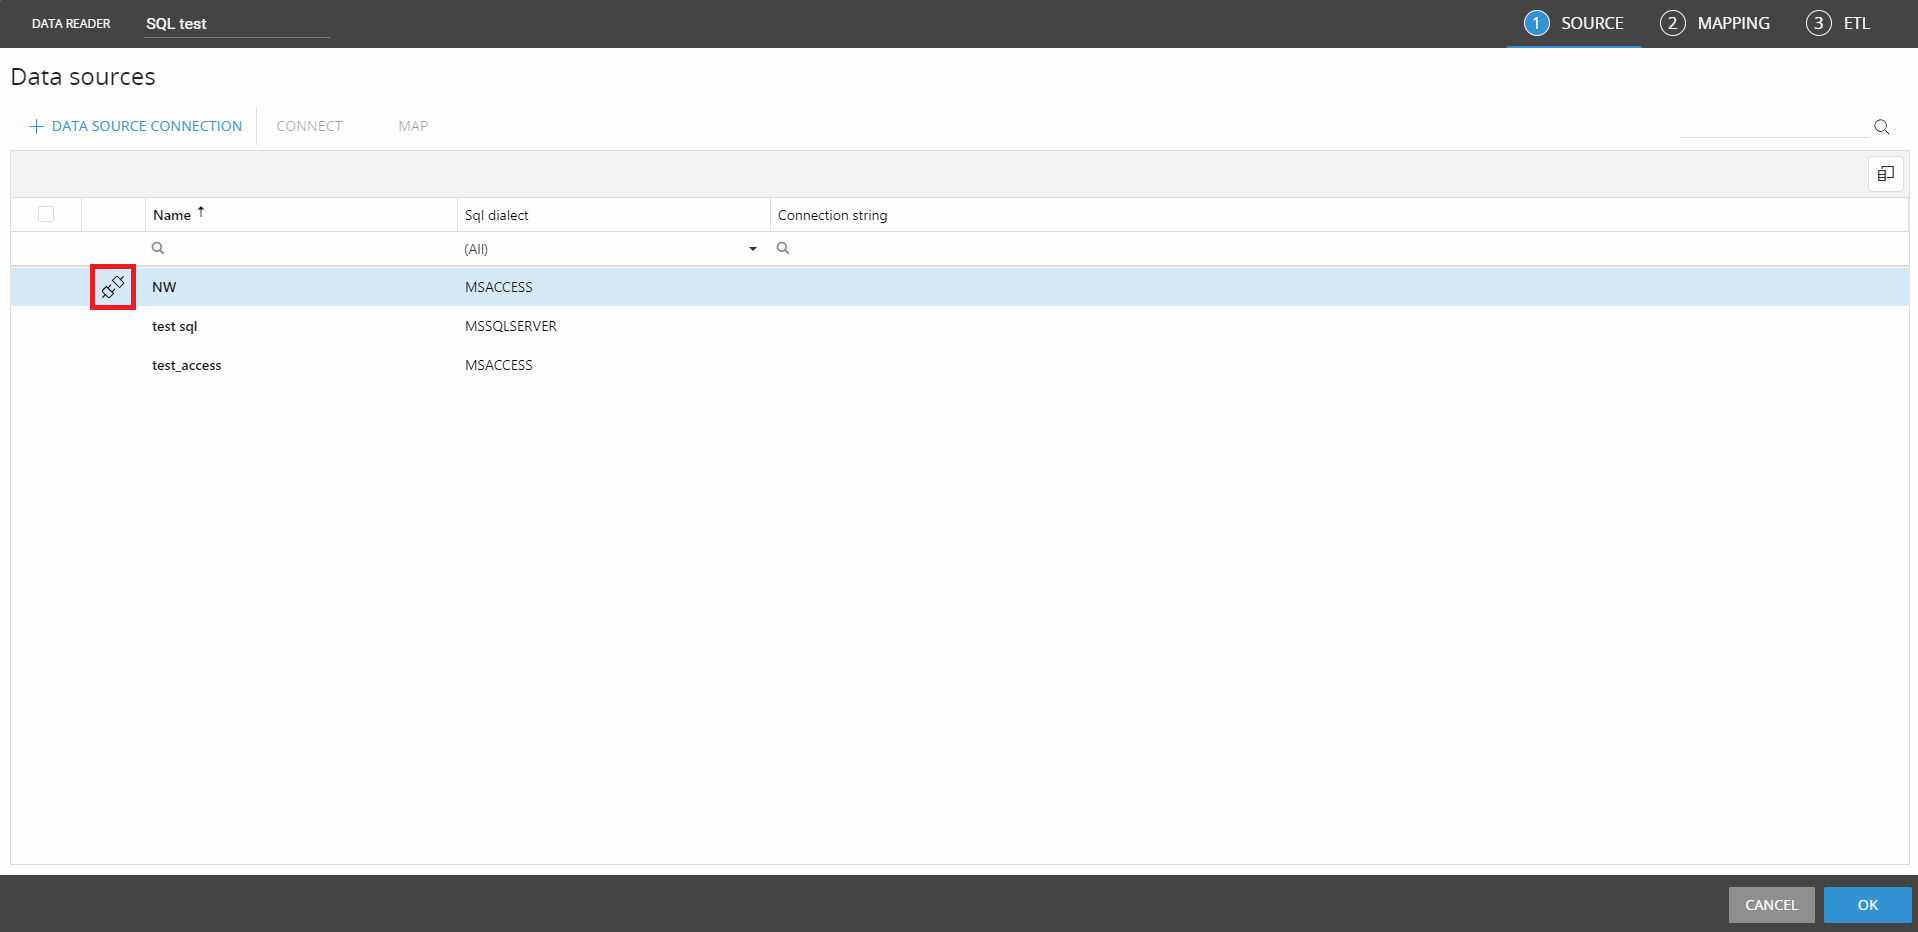
SOURCE
The first configuration step is the SOURCE settings. This tab shows the list of the existing connection protocols in the current environment. If the new data reader needs to pull data from an existing connection, click the connect icon before jumping in the mapping step.
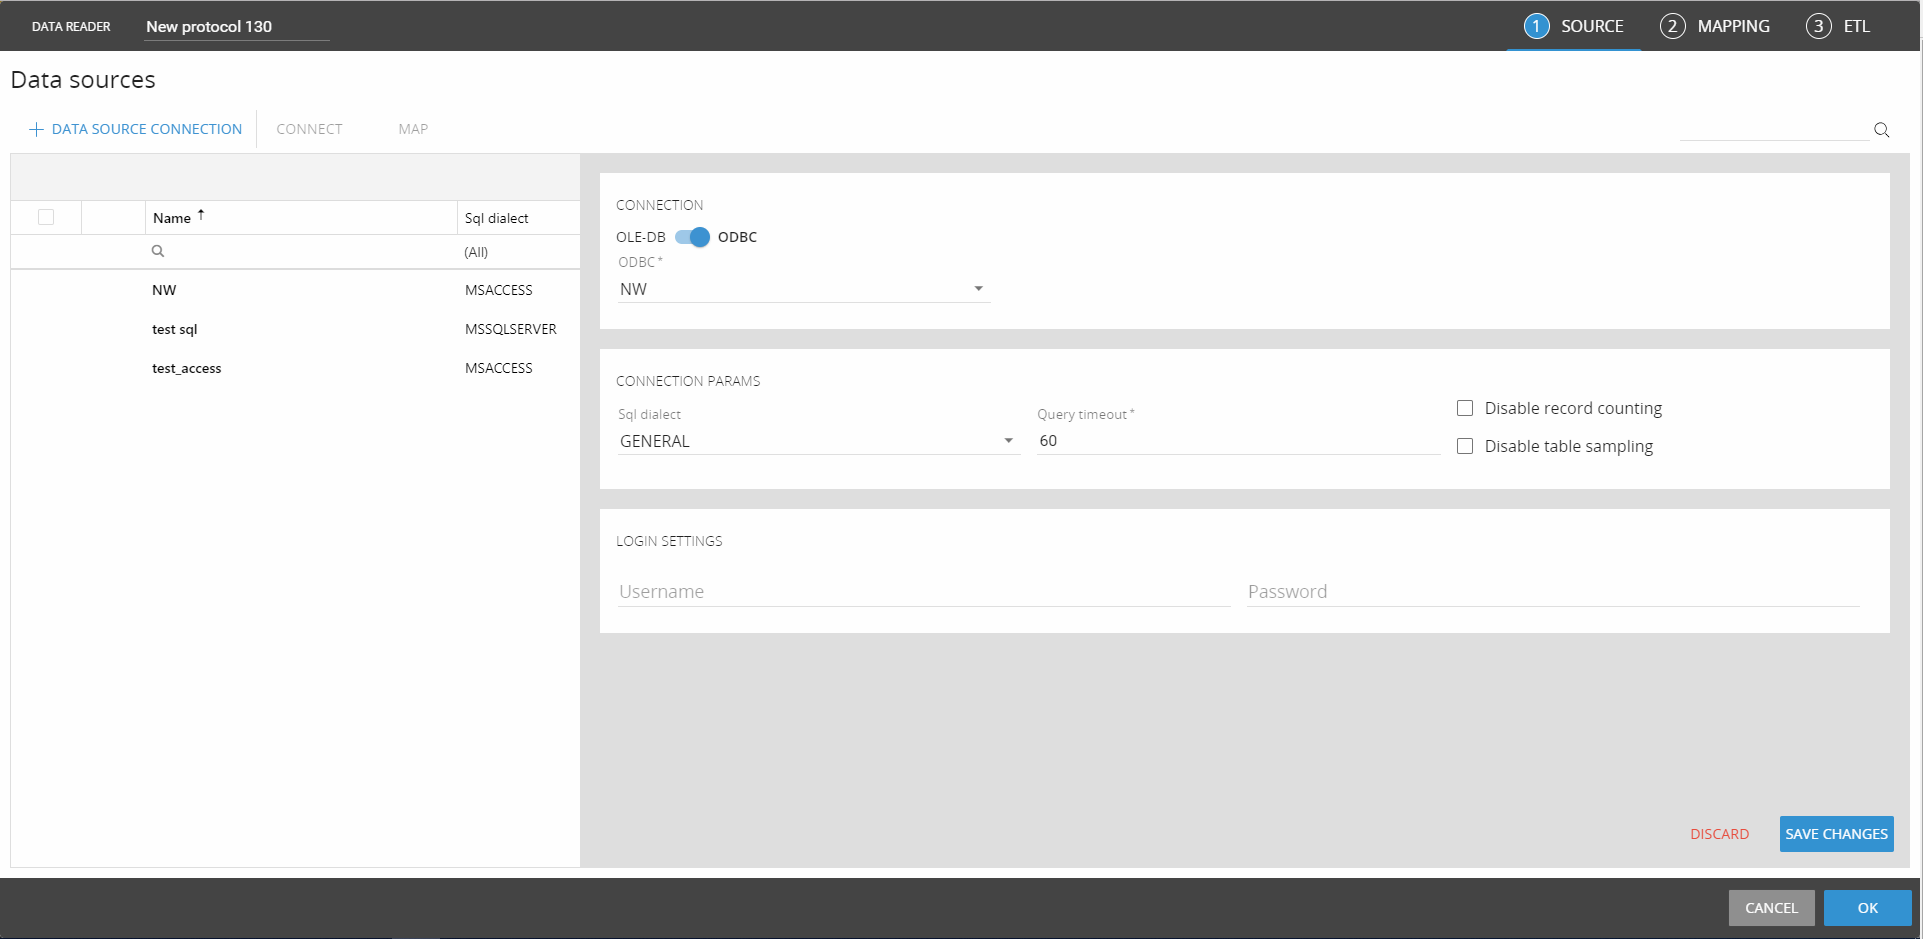
If the connection does not exist, it is possible to create a new one clicking the +DATA SOURCE CONNECTION button on the top .
There are 2 different connection type available:
ODBC
OLE-DB
The ODBC shows in a drop-down list the available ODBC protocols available in the BOARD server machine. Once selected, it requires some mandatory and some additional parameters that depends on the ODBC protocol . The parameters are: SQL dialect, query time-out, login username and password and disable record counting and disable table sampling.
The OLE-DB requires a name for the new protocol and a connection string.
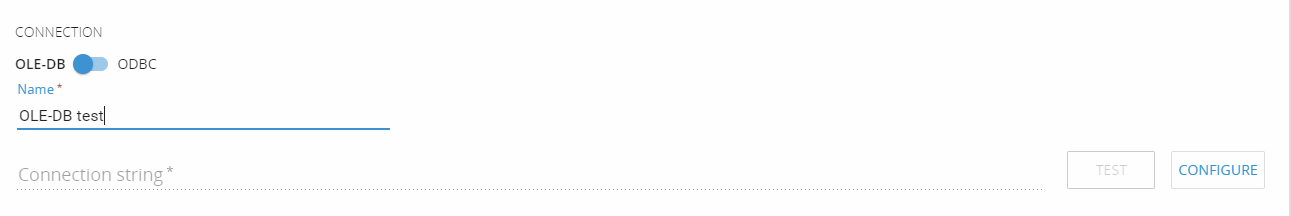
The connection string can be defined clicking on the configure button or just clicking on the connection string field. Then, a pop-up window is displayed for the configuration of the connection string.
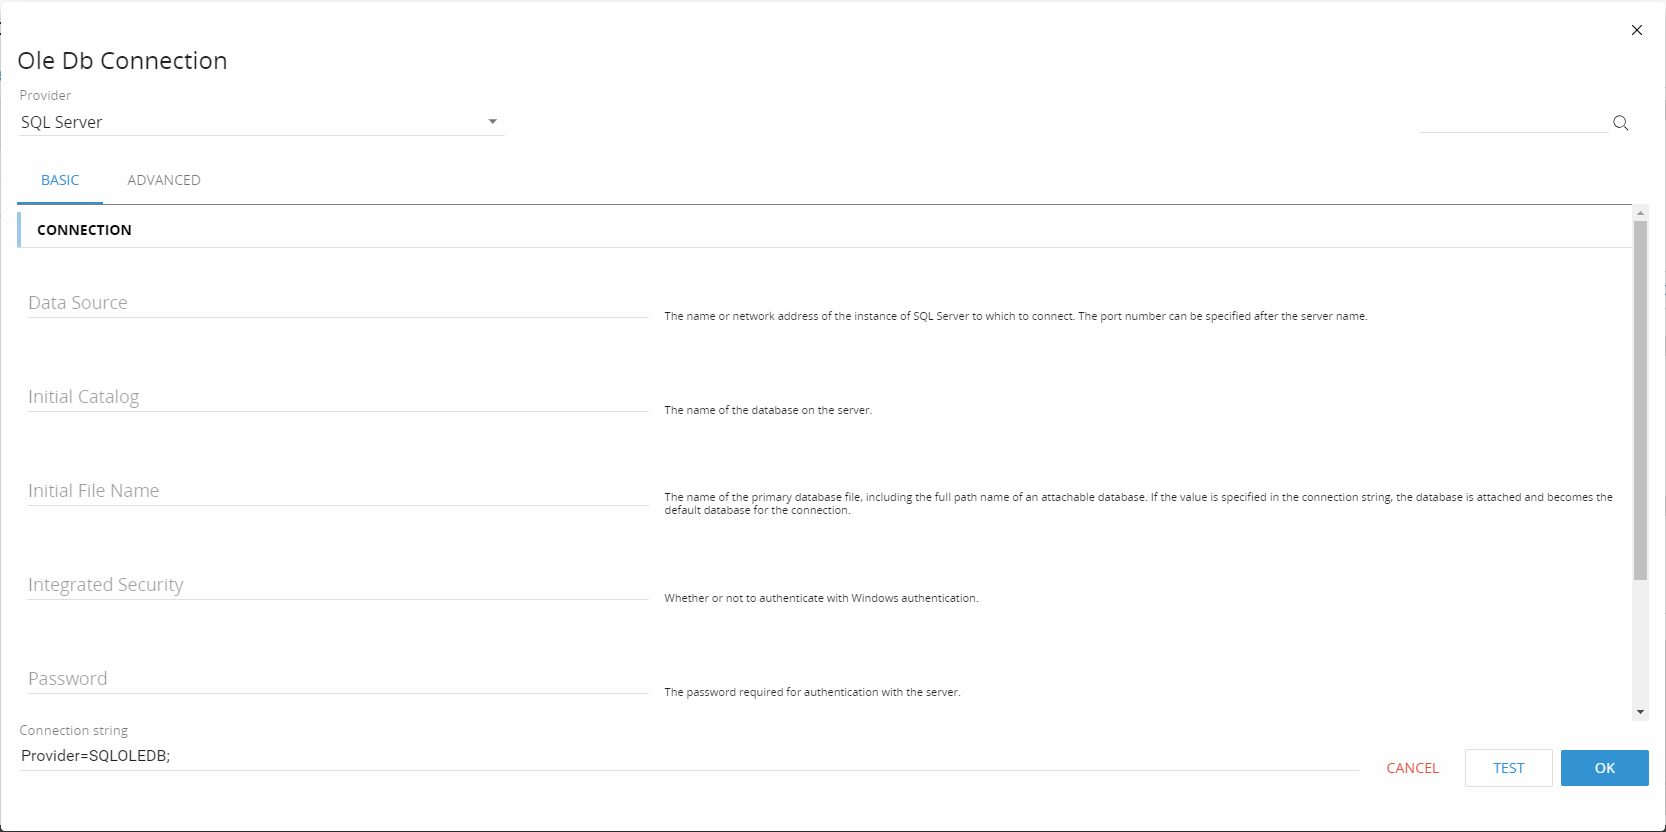
The requested parameters depend on the chosen provider.
MAPPING
In this step it is possible to map the MDB items (entities or cubes) with RDB tables and fields. The MDB items are listed on the left side, the RDB tables on the right side as below:
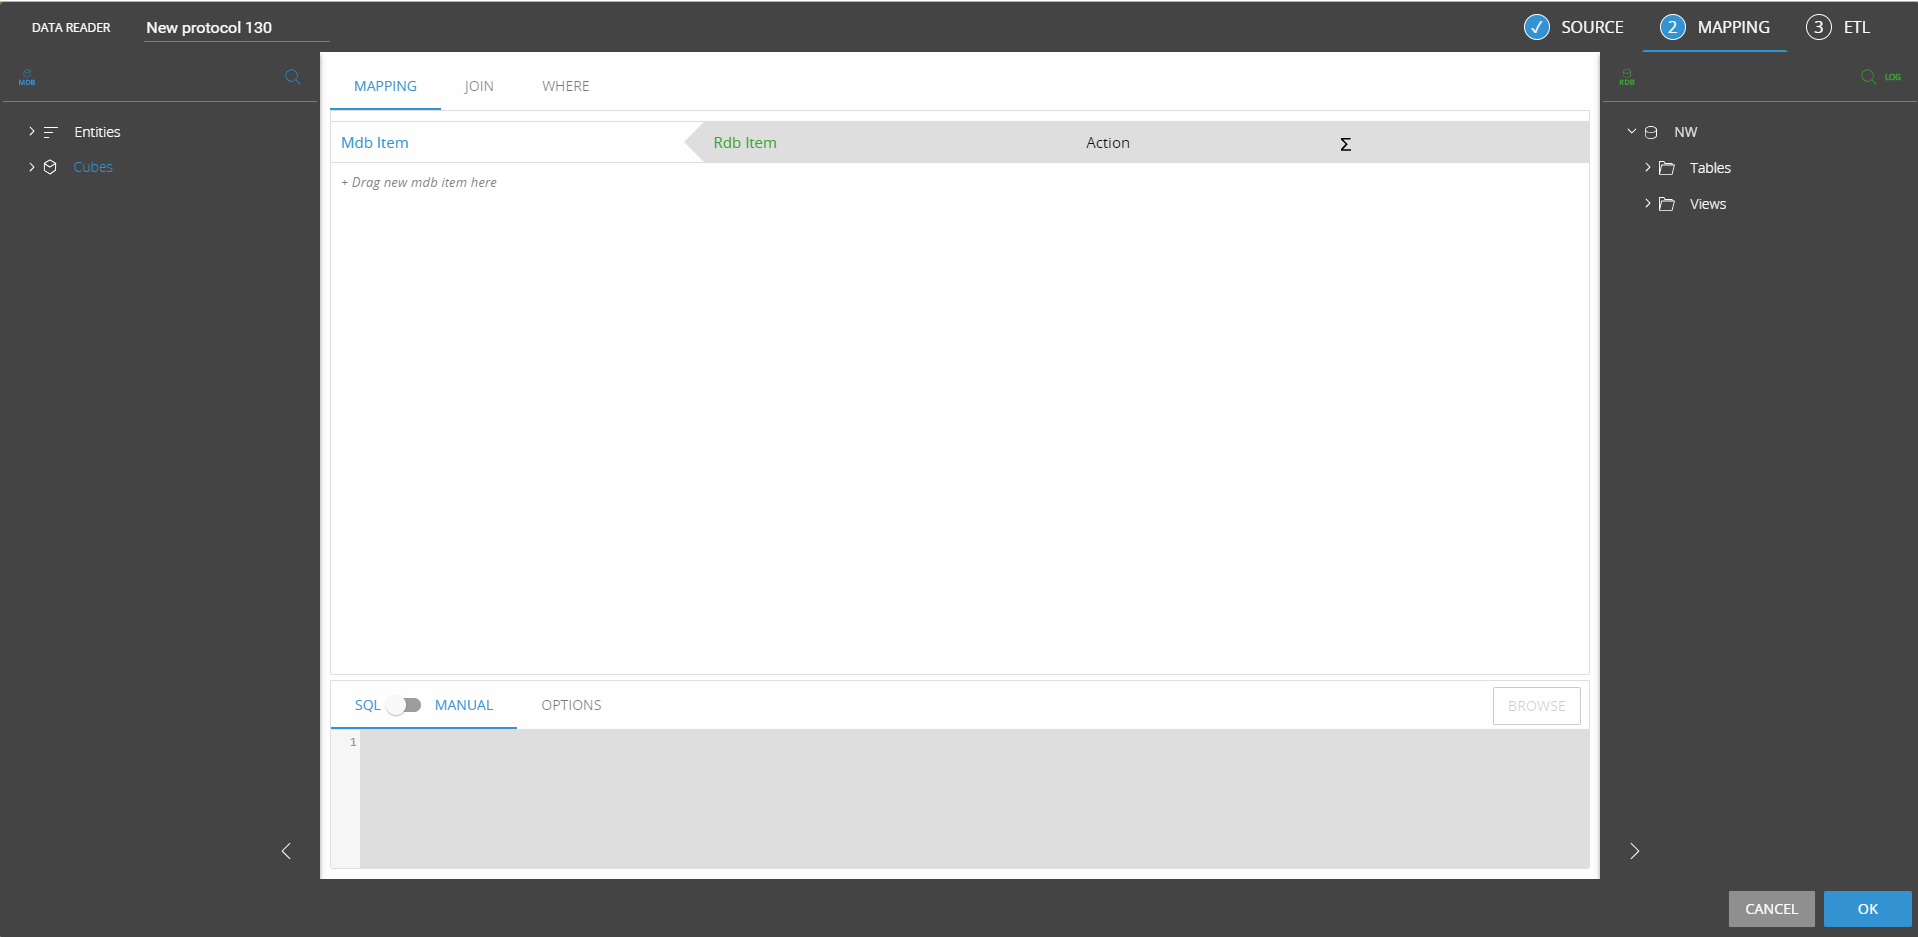
First Select the entities and InfoCubes to feed: the sliding panel located on the left displays all entities and InfoCubes of the current Board database. To select an entity
or InfoCube, use the mouse to drag and drop the desired item to the Central window. Then Drag and drop the table fields in the cell next to the entity or InfoCube you want
to feed, as illustrated..
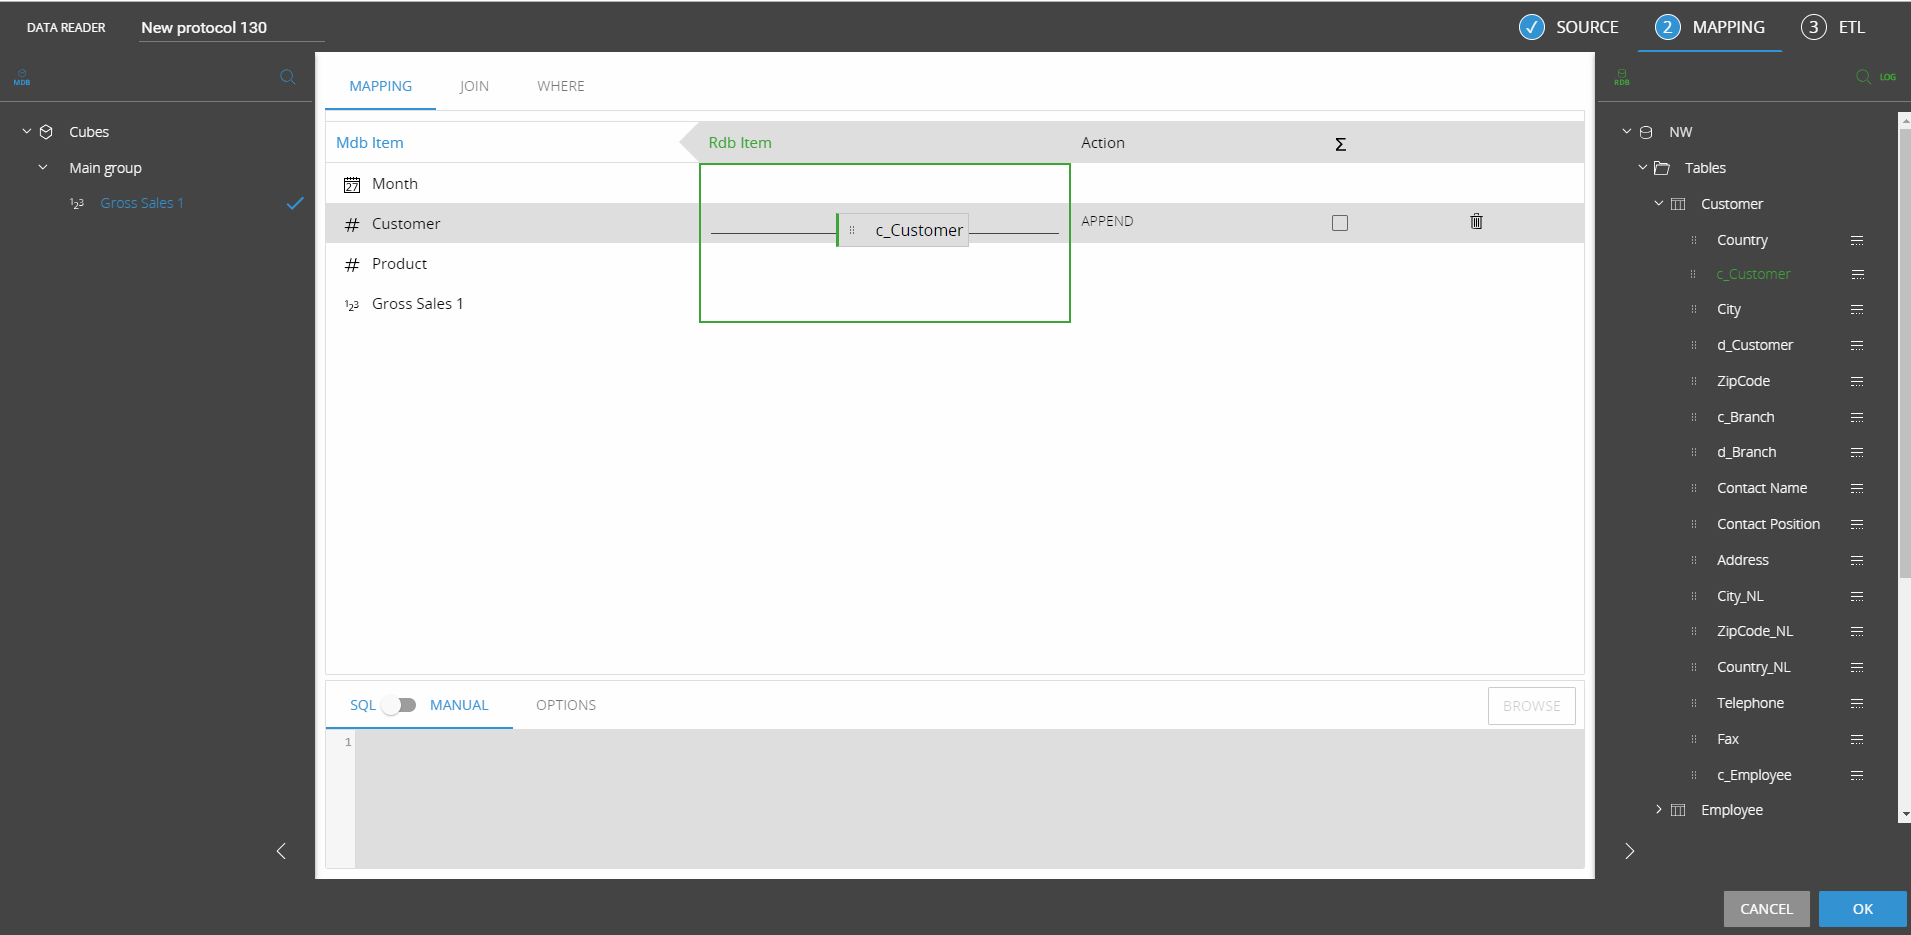
For each field (except standard Board Time entities), set the Append/Replace option as desired. Click on the cell to set the option as desired. Refer to the paragraph Append and Replace options for details.
If any JOIN is needed, it can be defined under the JOIN tab, clicking on the ADD JOIN button and then selecting the fields to join from the 2 drop down lists. A where condition can be defined manually under the WHERE tab.
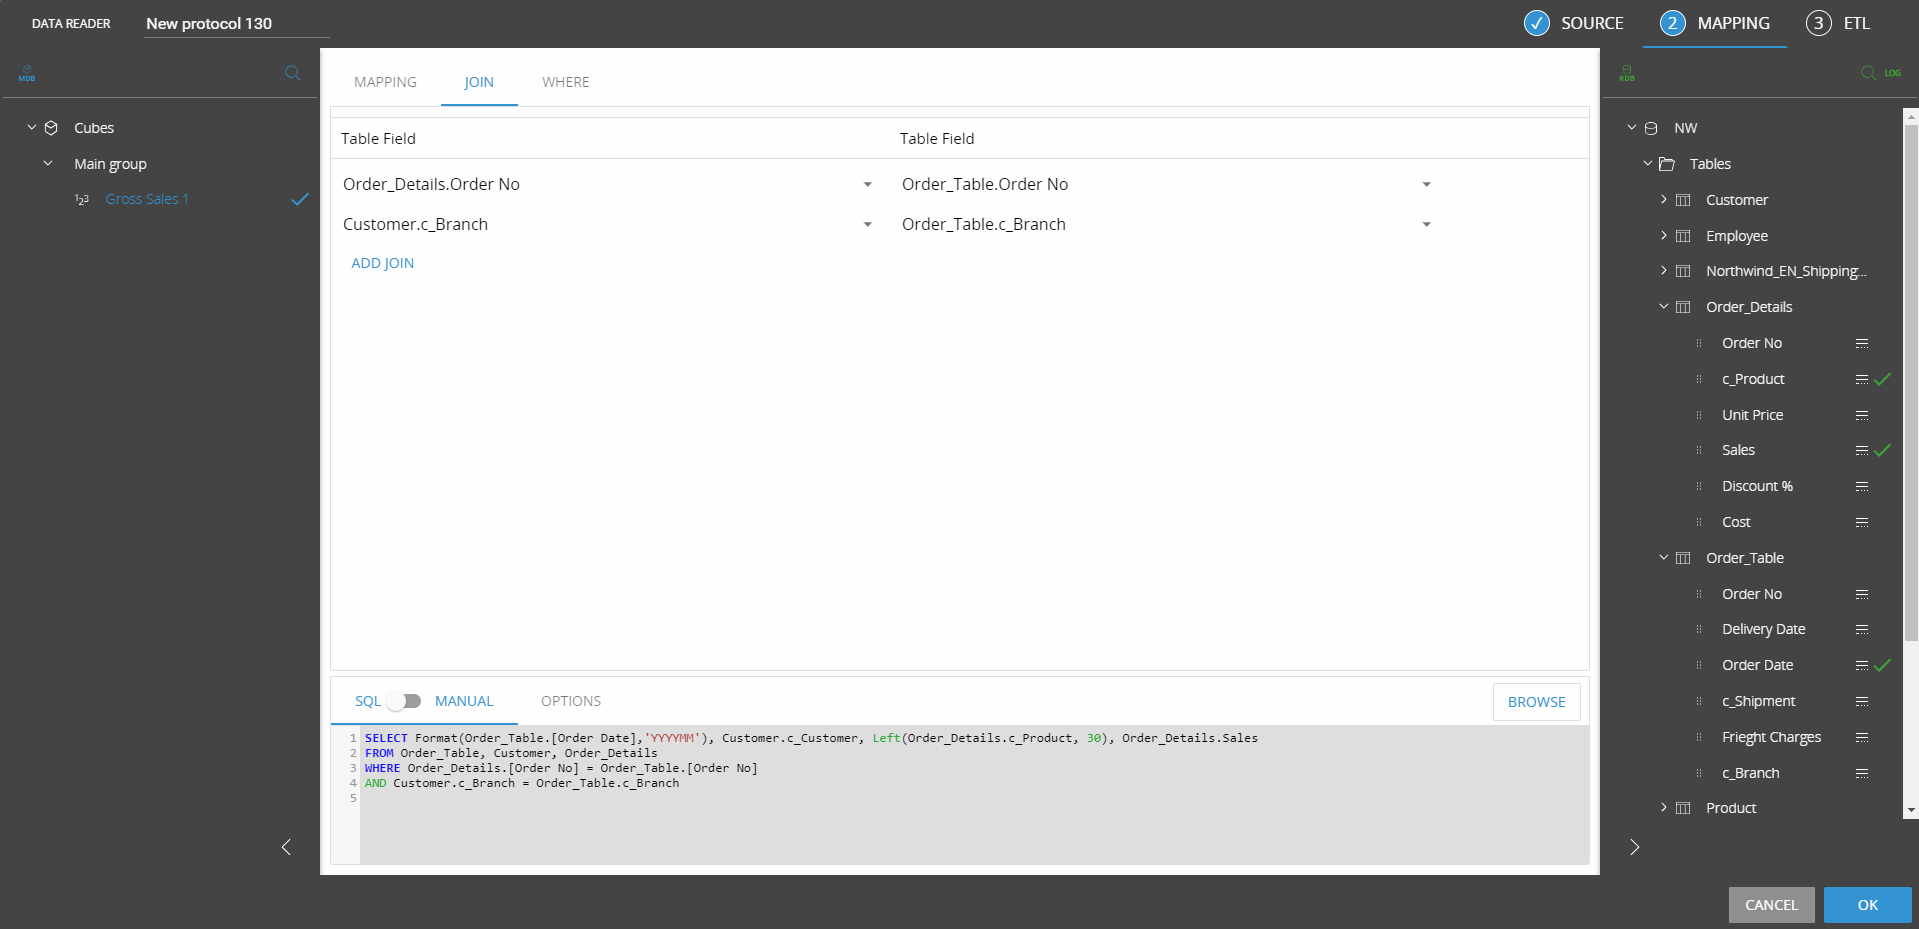
In the MANUAL Tab you can manually edit your SQL statement The data reader option such as data type, join syntax and date format are available under the OPTIONS tab.
Clicking the BROWSE button it shows a preview of the query execution and result.
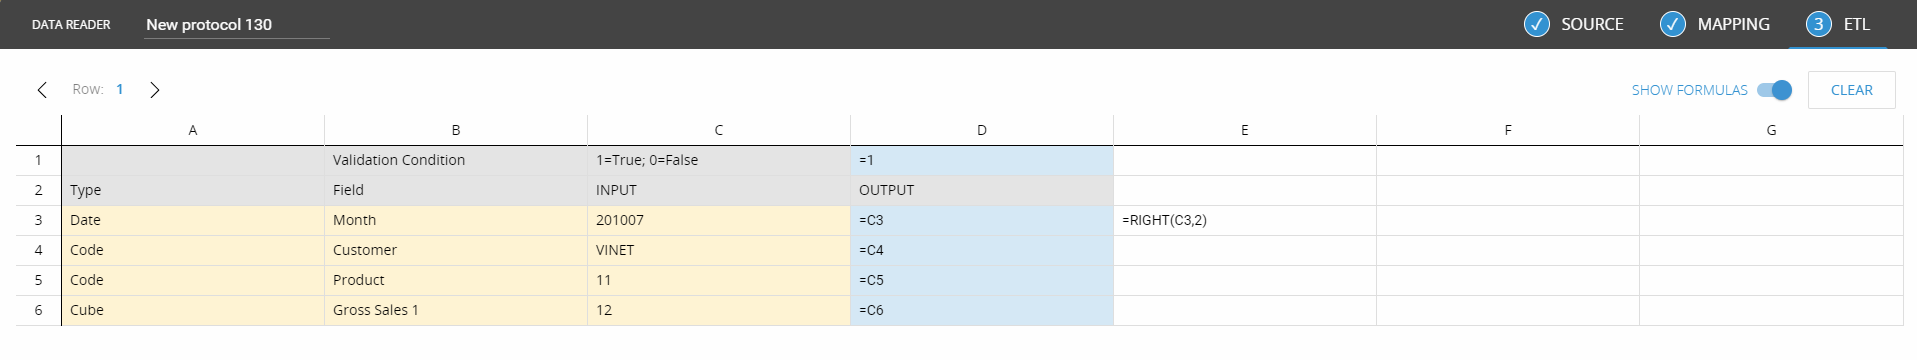
The ETL step allows the configuration of transformation formula on the incoming data. There a switch to show or not show the formula in the editor and arrows to display the incoming rows from the configured protocol.
After clicking OK for confirmation, the new data reader protocol will be available on the data reader list of the data model.
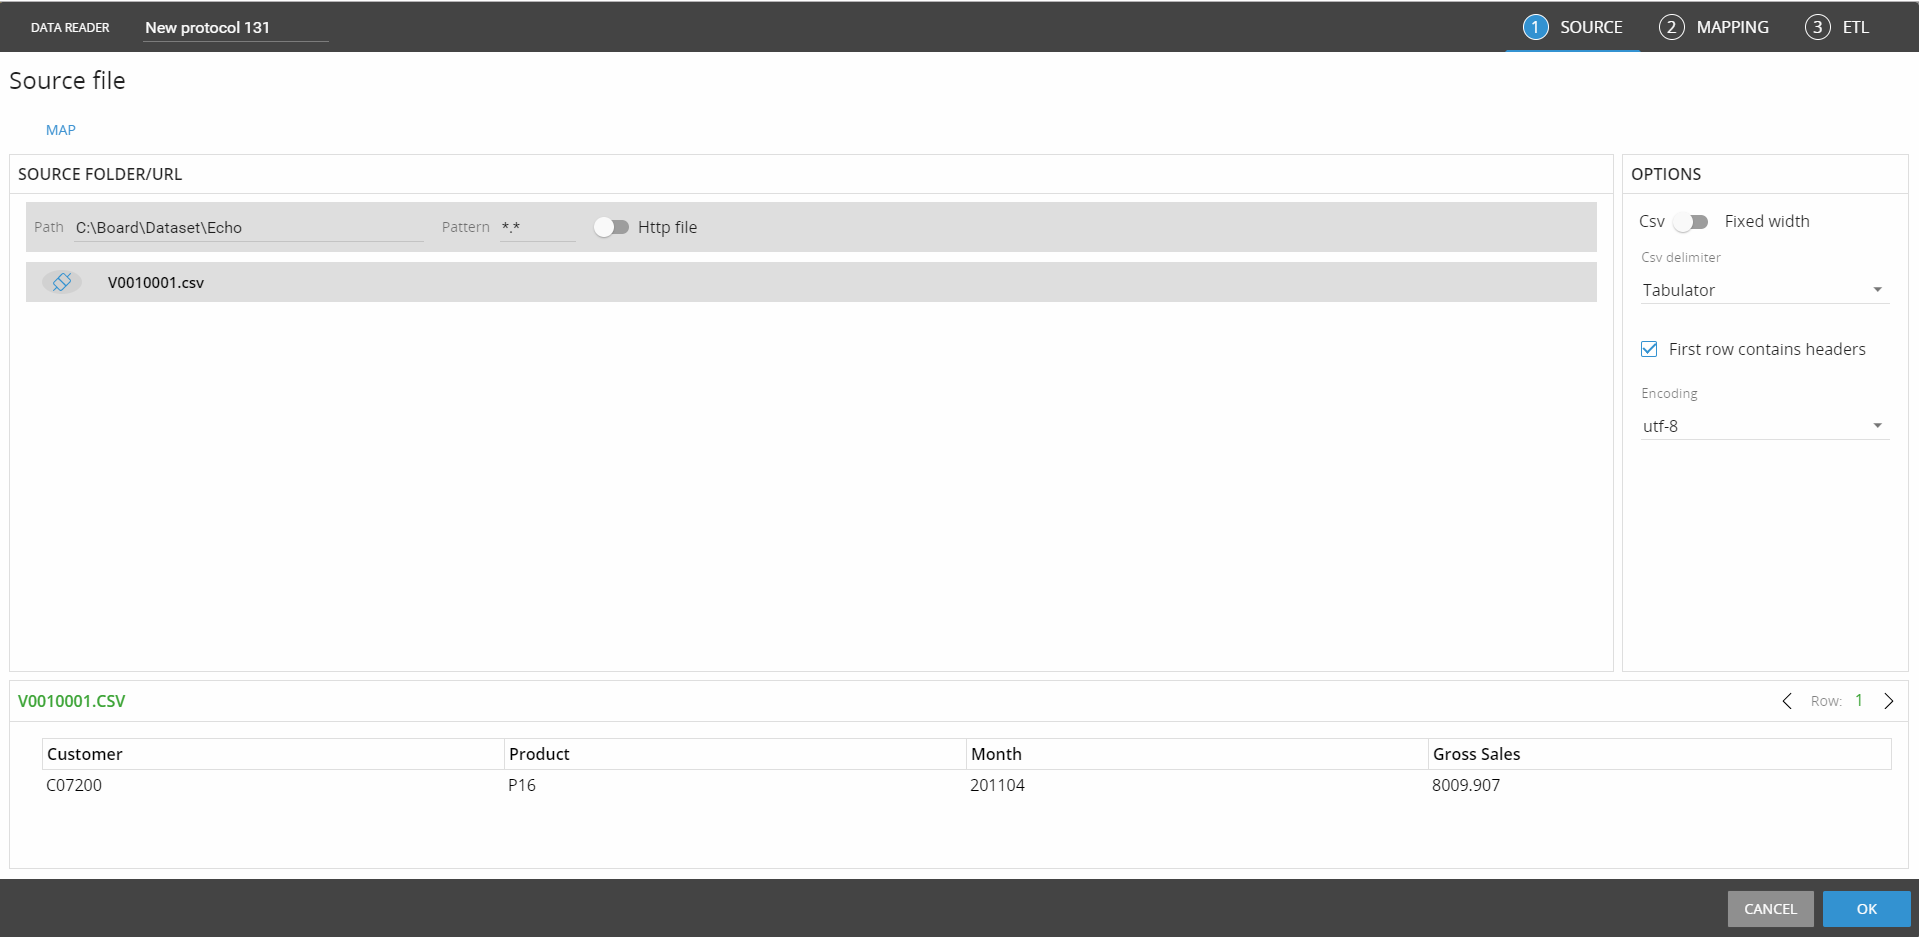
Text Protocols
The Source step of text protocols, shows the list of available files in the defined path. Once the path is defined and the file list is displayed, the connect icon is available and need to be clicked before to proceed with the mapping step. The options for the text protocol are available on the right side of the page.
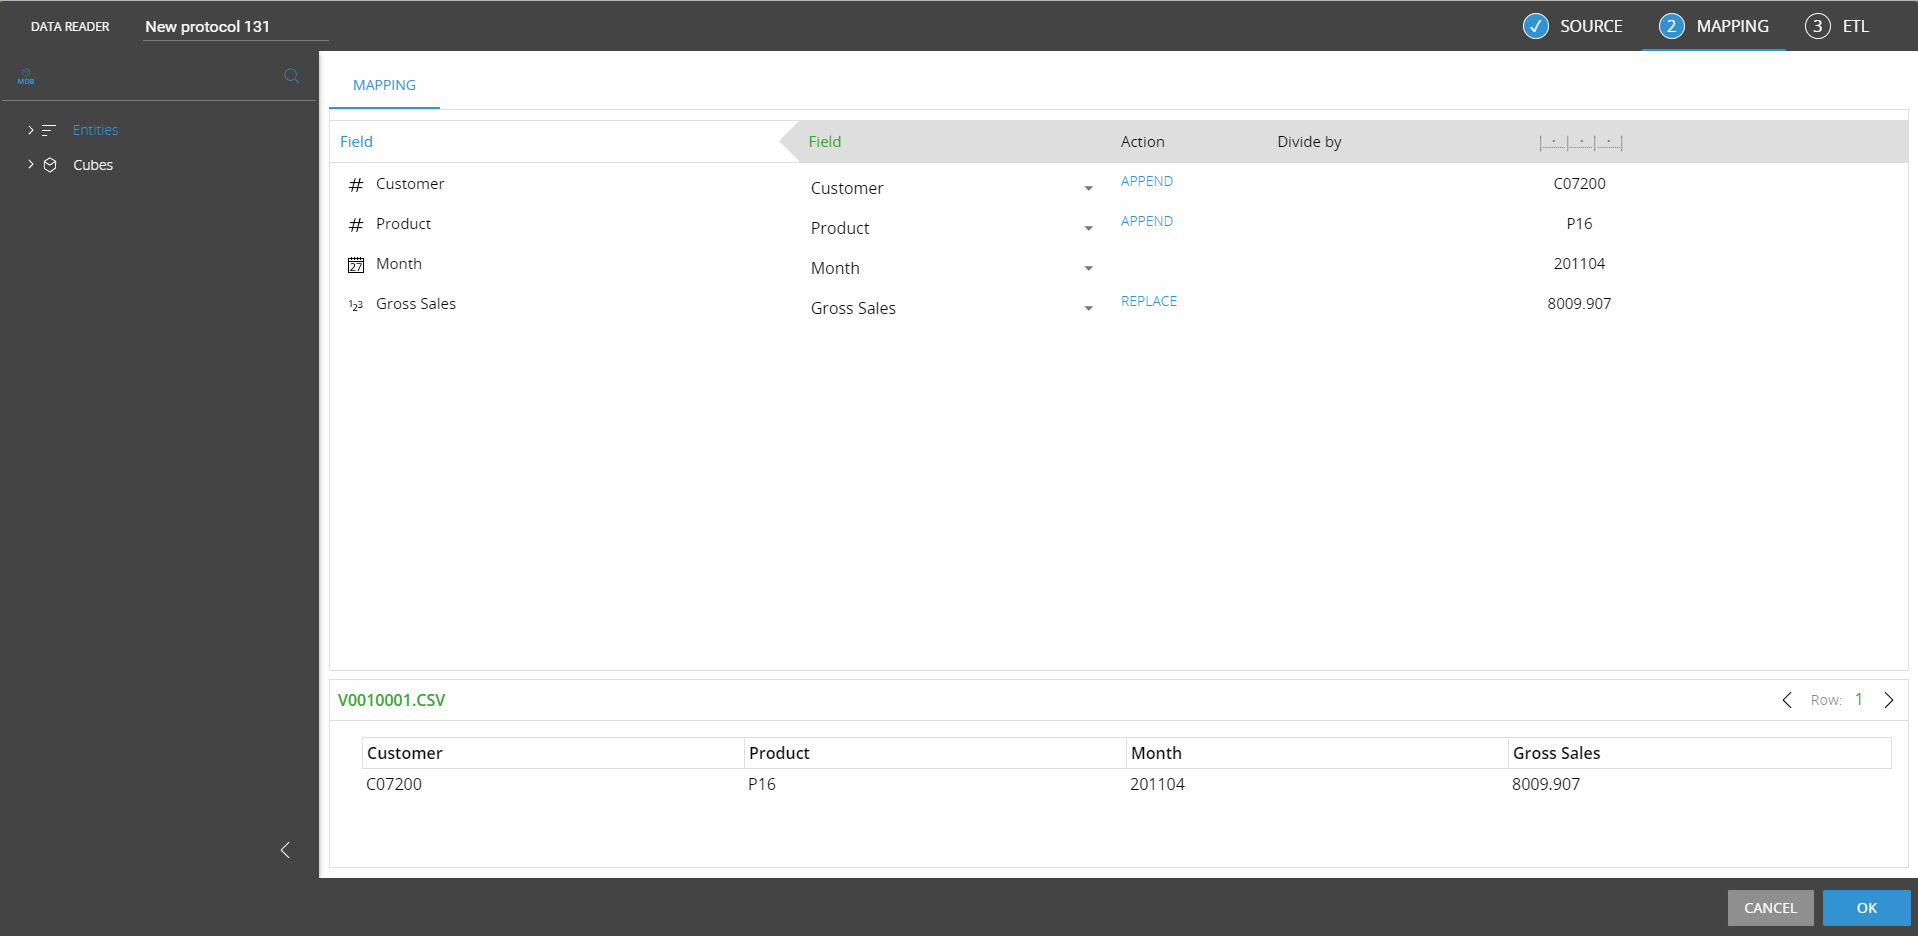
The Mapping steps only shows the MDB items on the left side. In the center of the page, the configuration has drop-down lists to map the text file columns to the MDB items. The actions like append and replace can be set-up clicking on the column action.
The ETL works exactly as for the SQL data reader protocols.
SAP protocols
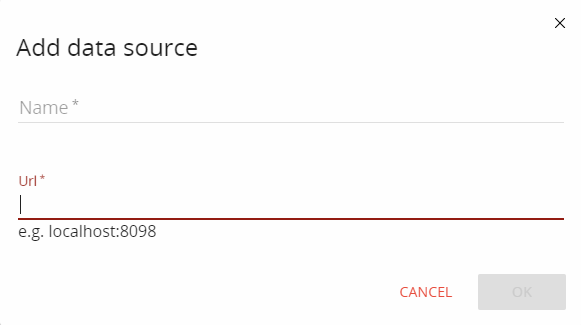
The creation of SAP protocols requires the configuration of a connection source. Click on the +CONNECTION button name the new source connection and the address of the SAP connector Server in the URL field.
The existing connections are listed under the source box. The connect button must be clicked before to proceed to the Mapping step.
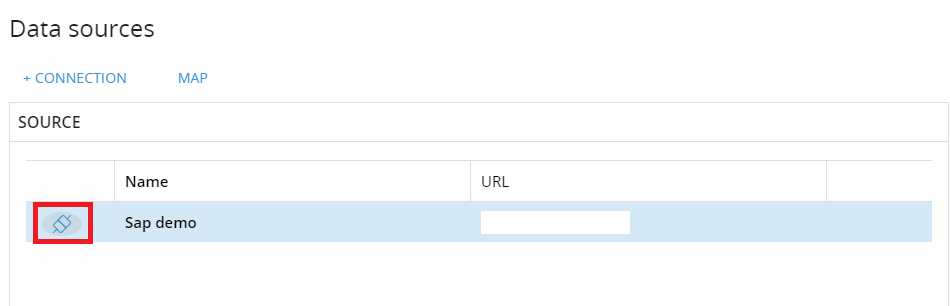
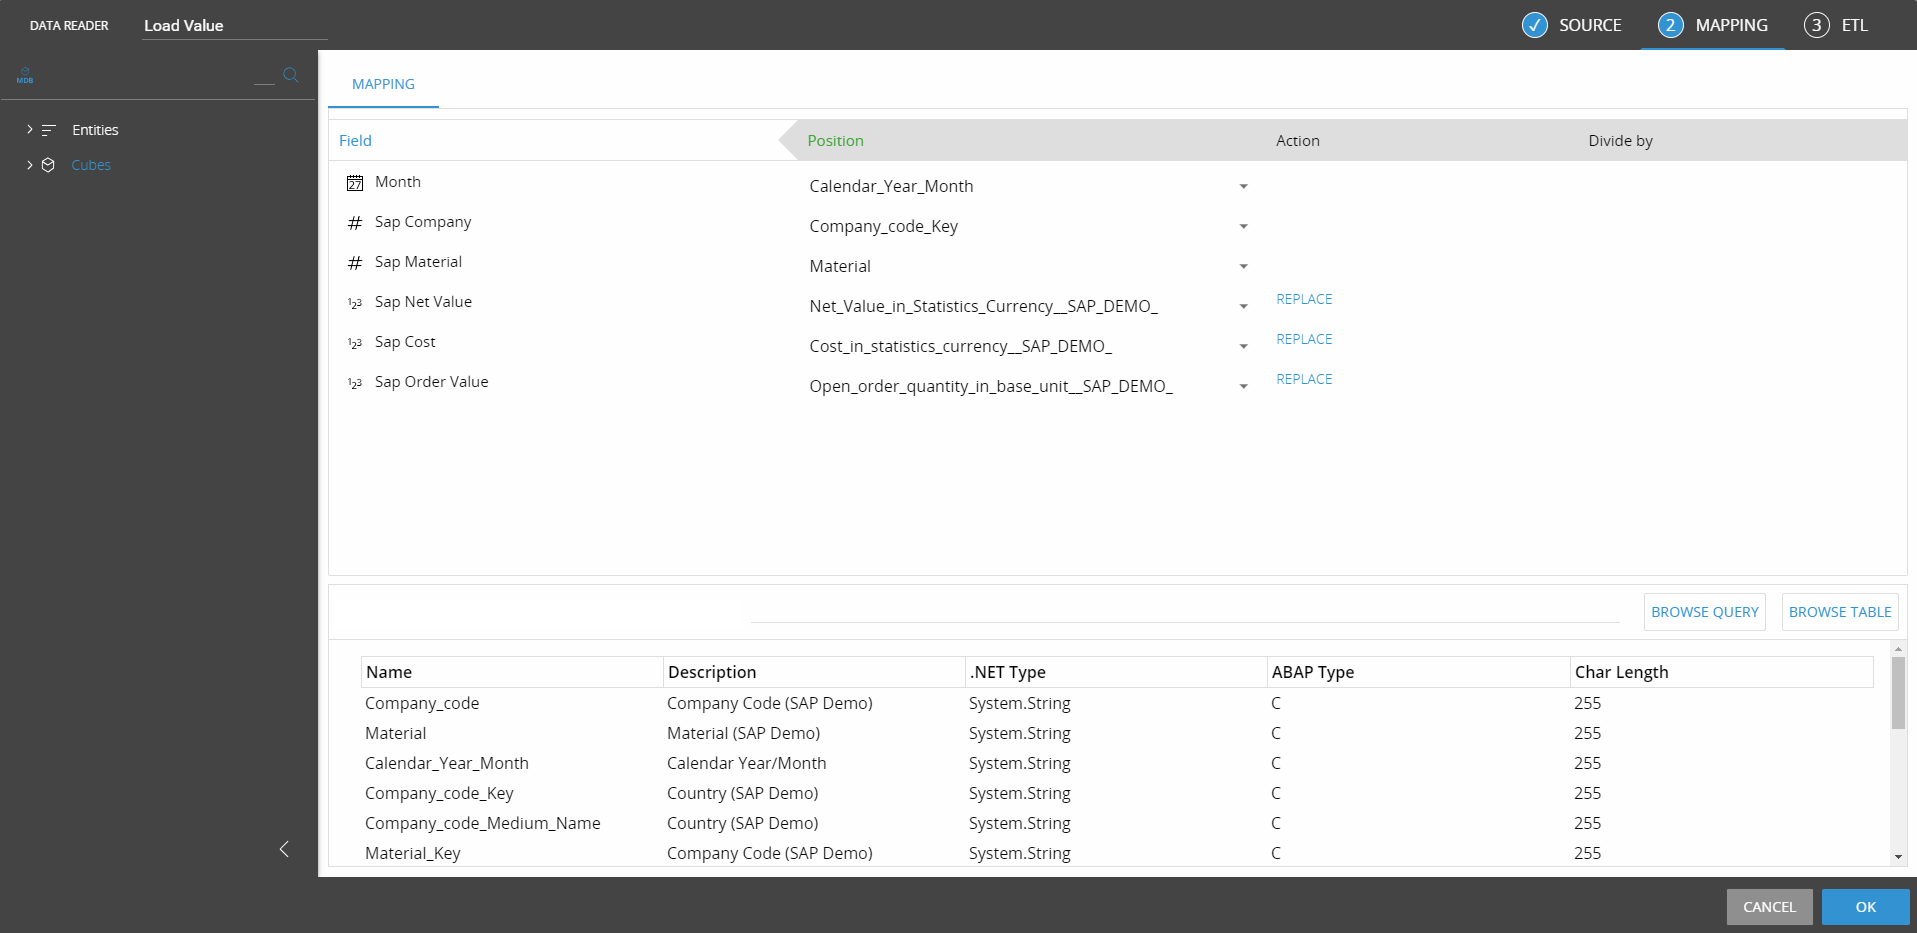
Once connected, the Extractor list is shown on the right sliding panel. Proceed with mapping as shown above.
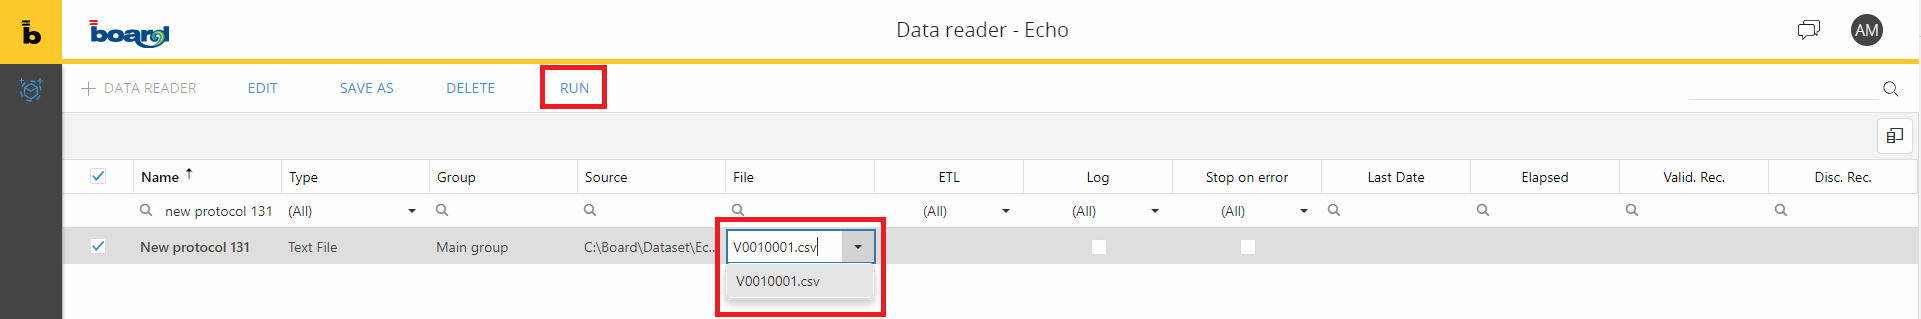
How to run a data reader
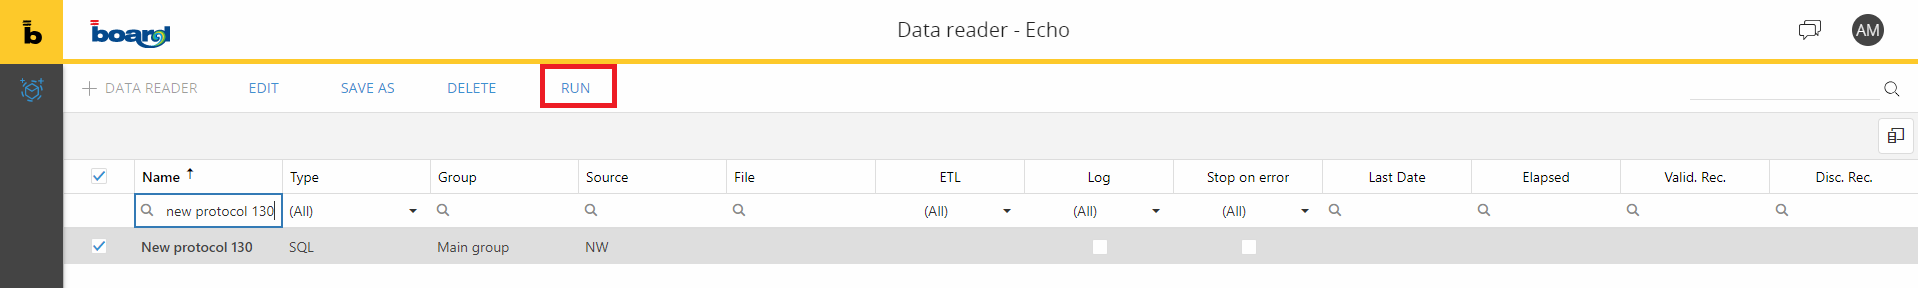
Select The data reader and click the RUN button as shown below.
For Text data reader the user needs to select the protocol and then select a source file from the drop down list available in the file column. Then click the RUN button .
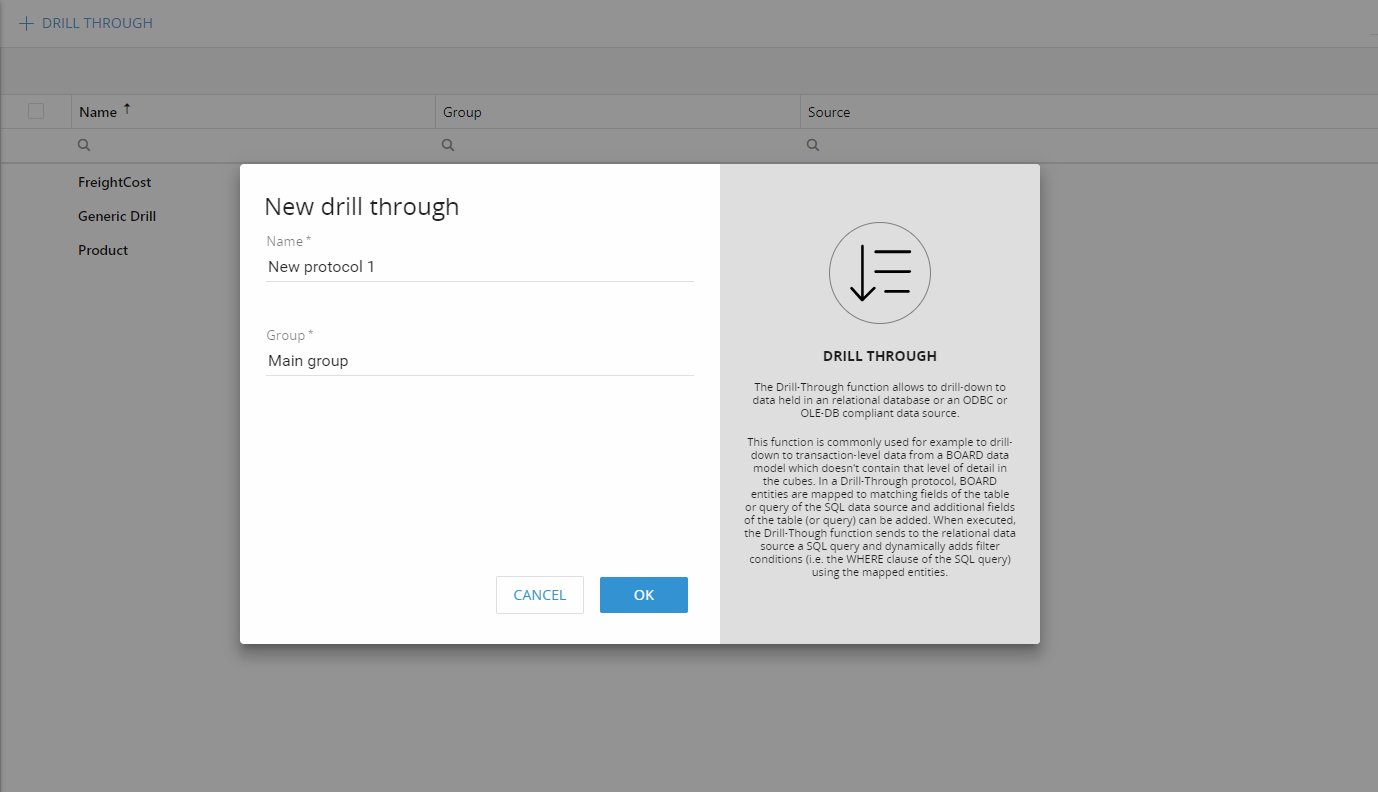
The Drill Through section shows the list of the drill through protocol configured in the data model. It is possible to define new drill through protocols clicking on the +DRILL THROUGH button.
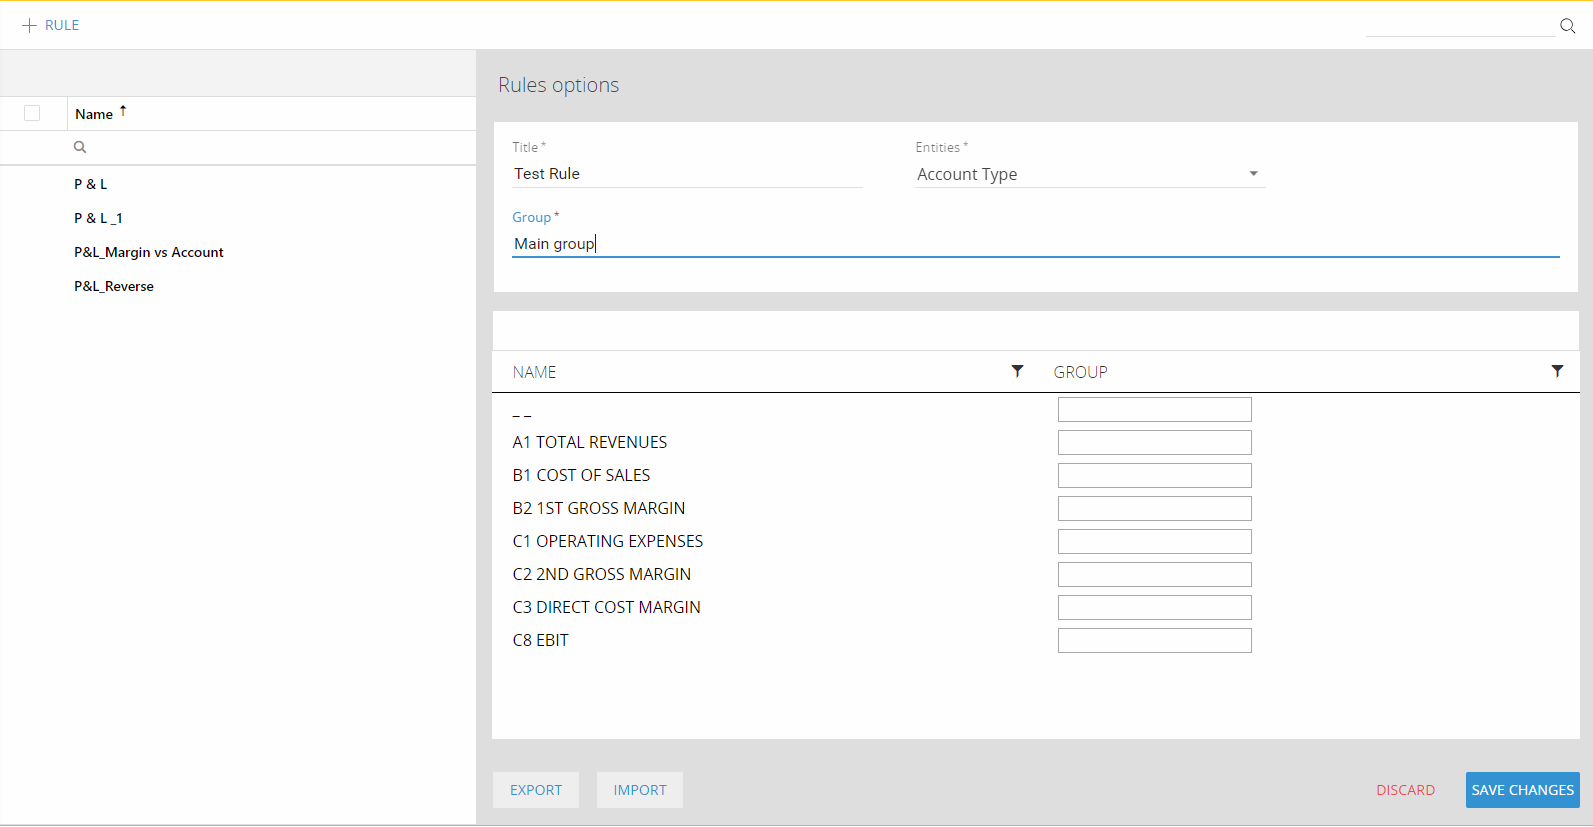
The Rules designer shows the list of the available rules in the Data Model. Clicking on the +RULE button it is possible to create a new rule definition. The create rule action opens a panel on the right side where it is possible to define the rule content, export or import the rule.
Time Range shows the time setting of the Data Model. You can read more about how to mange the time range HERE.

The Procedure space shows the list of data model procedures. It is possible to cerate a new procedure from the +PROCEDURE button available on the upper toolbar. You can read more about how to create a procedure from the web application and about the available steps HERE.
Under the logs section the database logs are shown. There are 3 tabs available: Operations, Diagnostics, DB List. HERE you can read more about the BOARD Logs.
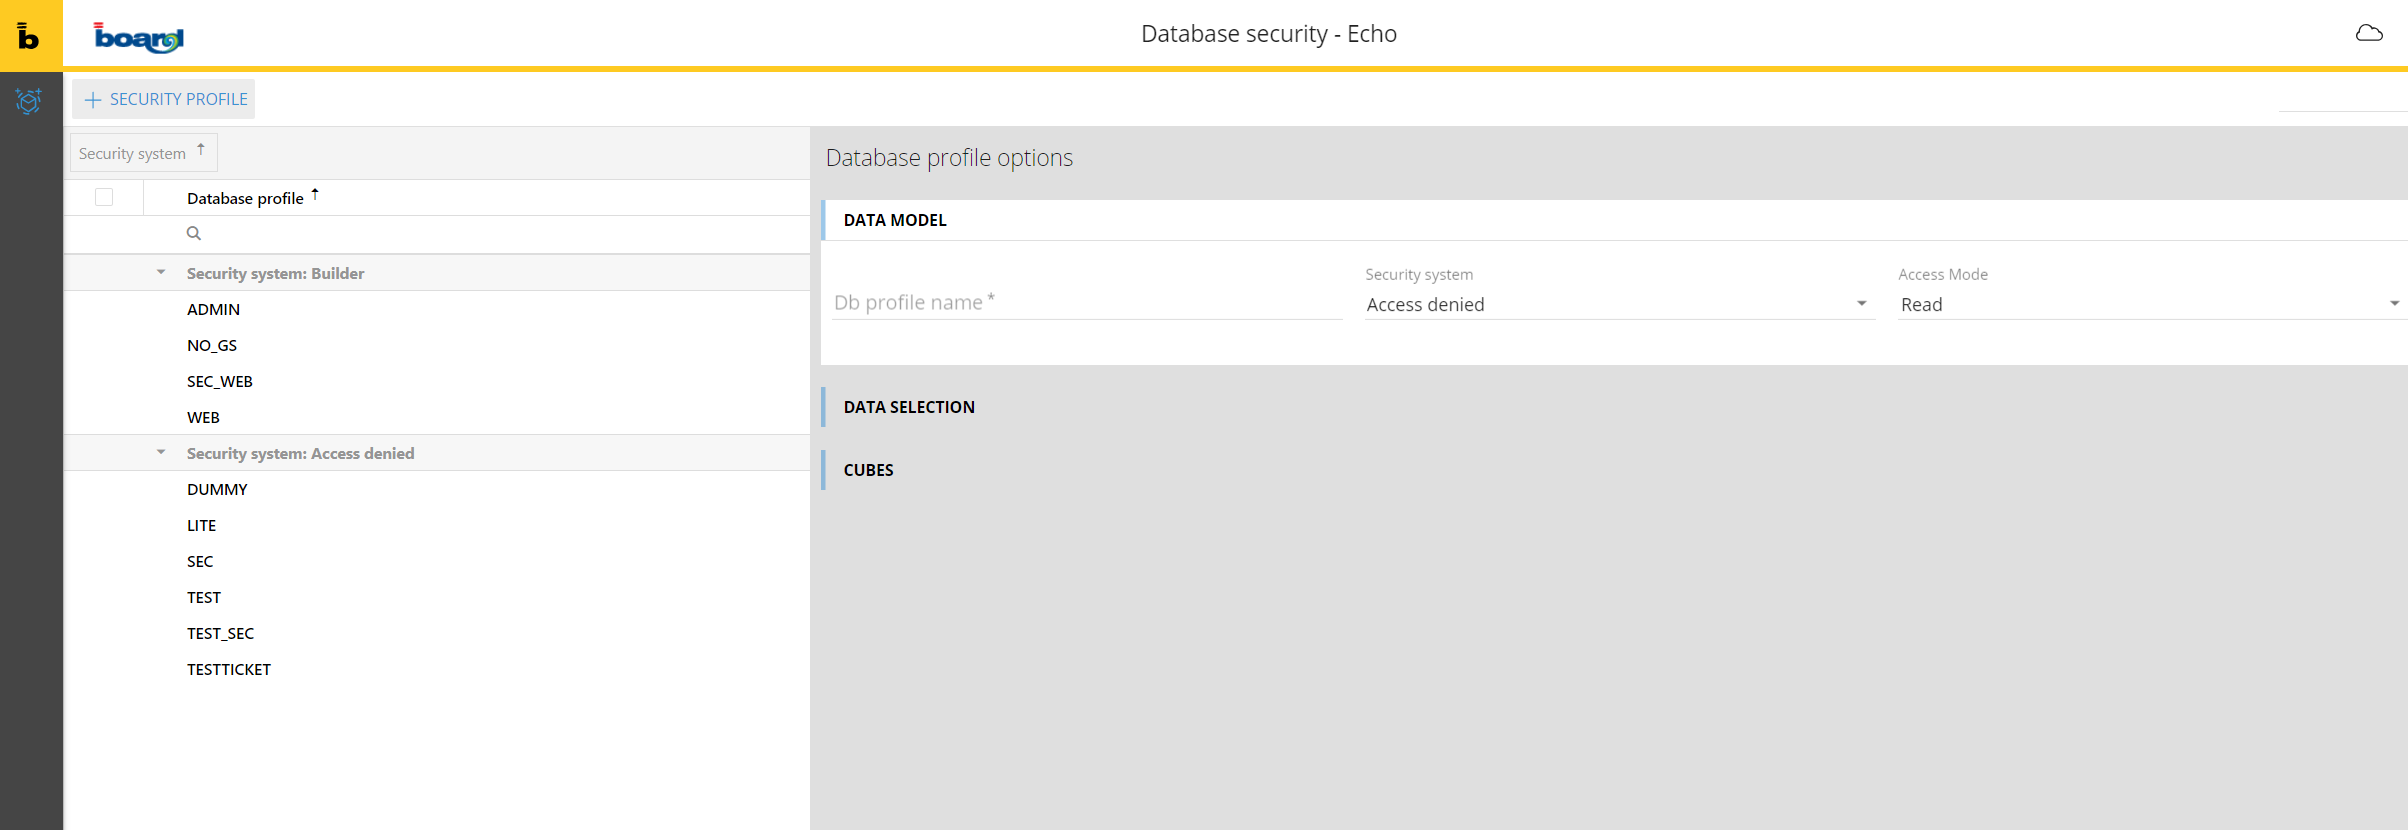
The Database Security space shows the security profiles created in the Data Model. It is possible to create a security profile from the +SECURITY PROFILE button. Here you can read more about the database security profiles.
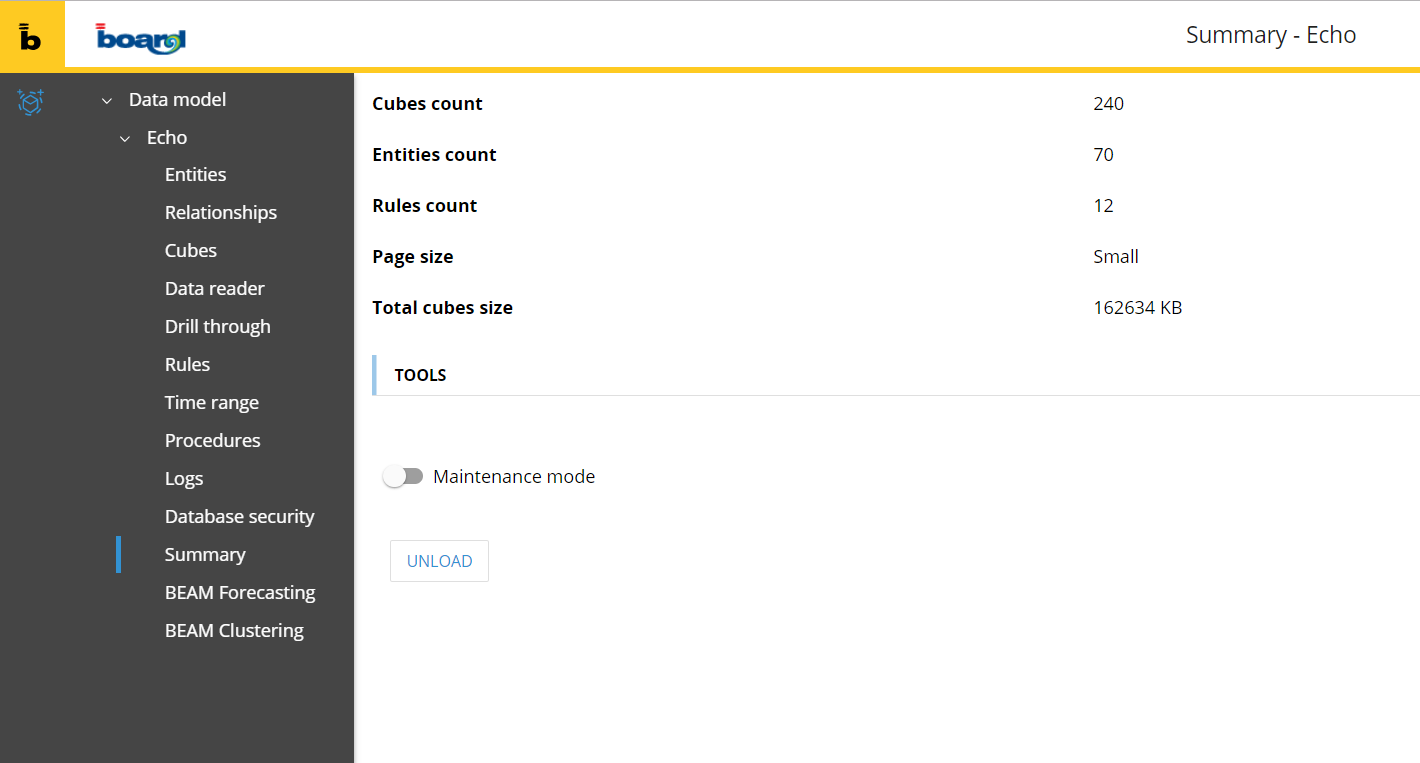
The Summary space is a new area available on the web application in version 10.5. It shows a summary of the relevant information of the data model. It shows the cubes, entities and rules count, the page size setting od the Data Model, and the total cube size on disk. It is possible from there to perform an unload action of the current data model.
The maintenance mode is a new functionality introduced in this version. The maintenance mode is available only to admin users. When enabled the Data Model is not accessible to all the other users logged in the system: new request to he Data model are rejected, existing logged users can't refresh or perform actions. The maintenance mode is suggested during a maintenance window. When an admin user enable it, if there are still jobs in execution, there is a 2 mins time-out that checks if the pending jobs are completed. If after the time-out the jobs are still running the maintenance mode is enabled and the pending steps are completed (if a user is in the middle of a procedure, only the step that was running during the maintenance mode activation will be completed).
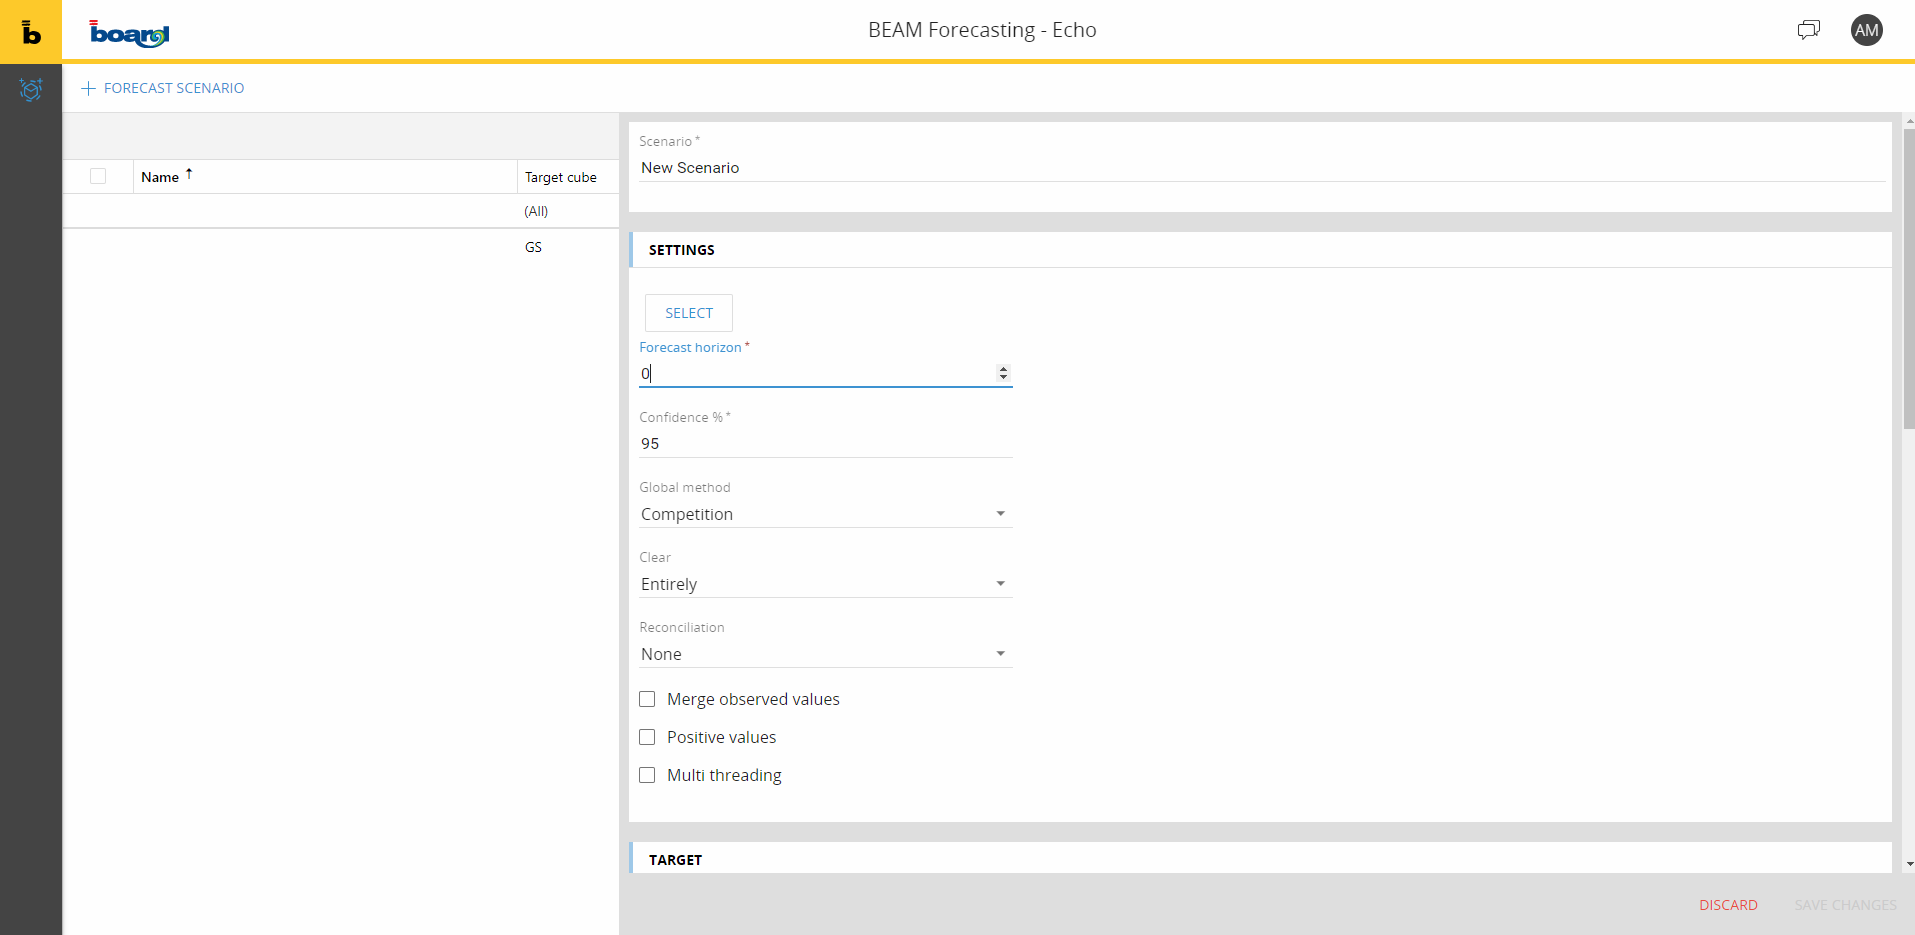
From the BEAM Forecasting area it is possible to define new forecasting scenario. When the user enter in this space, the list of the existing scenario is displayed. Then, clicking on the button +FORECAST SCENARIO in the top bar, it is possible to create a new Forecast Scenario.
You can read more about BEAM Forecast and how to create a scenario HERE.
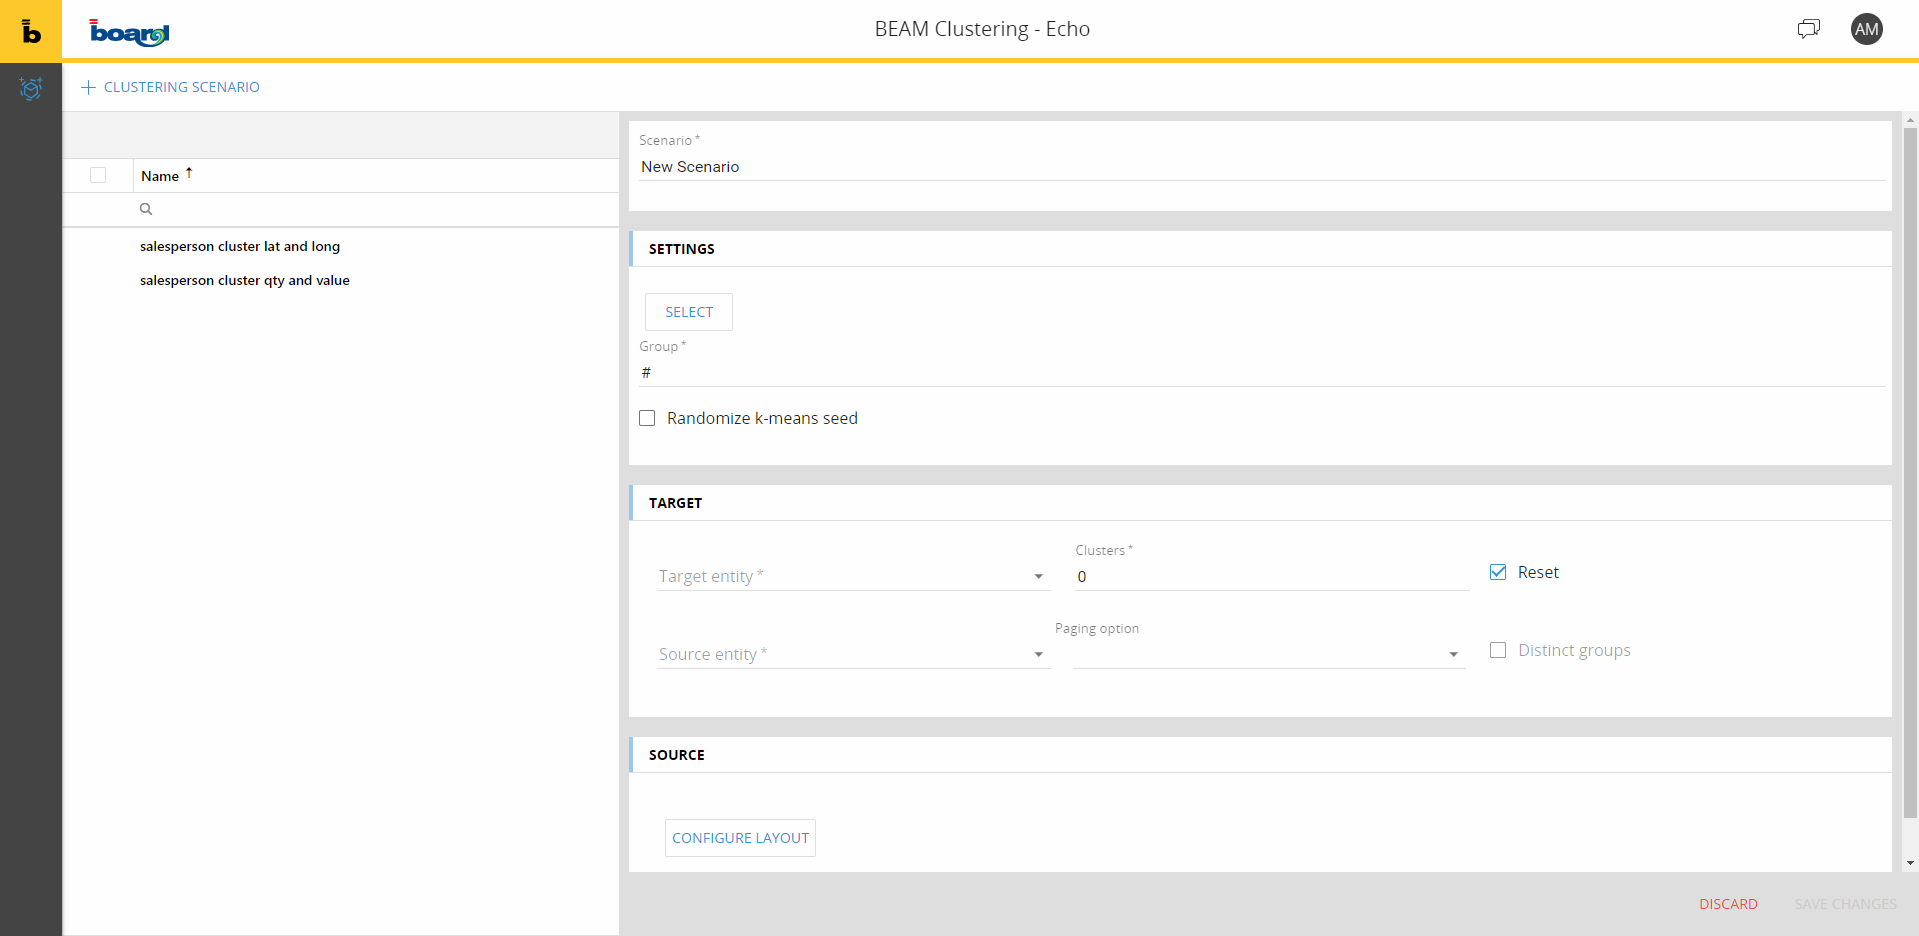
From the BEAM Clustering area it is possible to define new clustering scenario. When the user enter in this space, the list of the existing scenario is displayed. Then, clicking on the button +CLUSTERING SCENARIO in the top bar, it is possible to create a new Forecast Scenario.
You can read more about BEAM Clustering and how to create a scenario HERE.