About Data Modeling
Implementing the Board's Data model is the final phase of a broader project implementation process that starts with gathering and analyzing end users requirements and results in defining the multidimensional Data model specifications.
Why multidimensional?
Operational systems, based on relational Data models, are developed to store and work with single transactions, but decision-makers need information, not transaction details.
Moreover, to get information out of transaction details, the data has to be logically summarized. The aggregation of data in a relational Data model can require complex calculations such as:
- Looking up all appropriate data
- Grouping data
- Adding the data for each group
Multidimensional Data models offer a considerably higher performance, since data is aggregated for fast retrievals through the different layers, over all dimensions. This means that they can easily withstand the extensive querying that's typically needed for complex business intelligence solutions.
Multidimensional analysis also allows you to look at information from different perspectives (Slice & Dice) or from different layers based on the data structure: this approach lets you extract and visualize data exactly the way you want it.
Thanks to the flexibility, adaptability and scalability of Board's multidimensional Data model, you can adopt a highly iterative development approach by quickly cycling through your product's life cycle stages multiple times.
If we consider a traditional waterfall model, the life cycle stages for each project typically are:
- Requirements analysis
- Design
- Implementation
- Integration and testing
- Delivery
- Feedback
Board considerably shortens all stages, starting from the "implementation" phase down to the "feedback" phase.
The Board Data model
All Board Data models consist of the following three elements:
- Entities: these are information sets, generally text and codes. For example, inside a single Entity there could be a list of Customers, Products or Cities. Entities (and hierarchies) are the Cubes dimensions
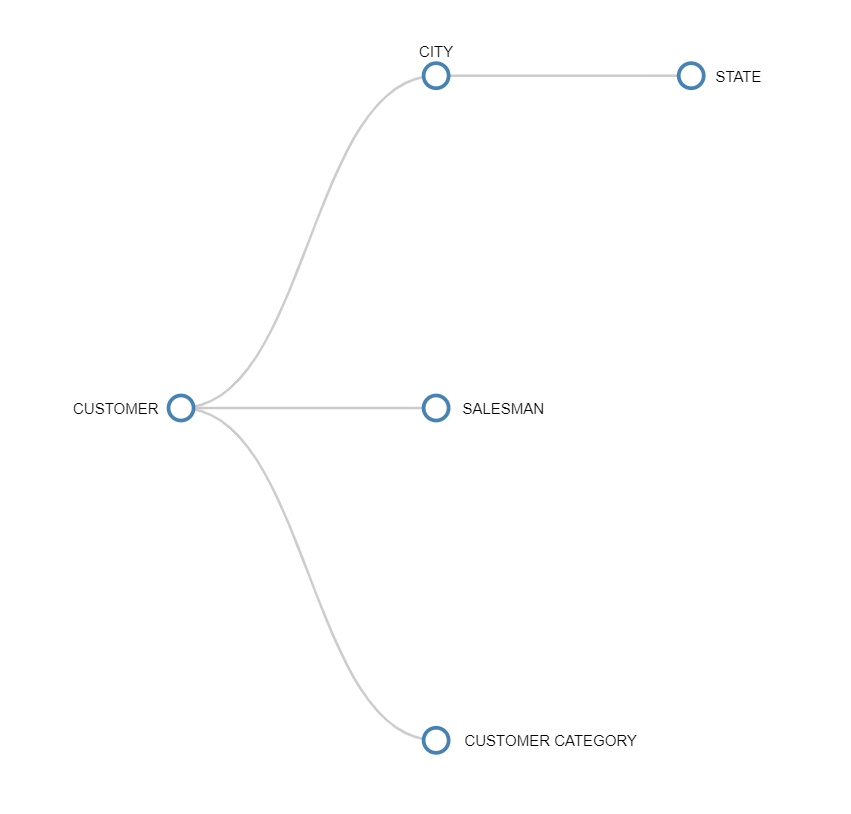
- Relationships (hierarchies): when two or more Entities have a many-to-one relation, then a Relationship (or hierarchy) can be defined. For example, the entities Customer, City and State can be organized into the Relationship "Customer → City → State" since there is a many-to-one relationship existing between Customer and City and between City and State
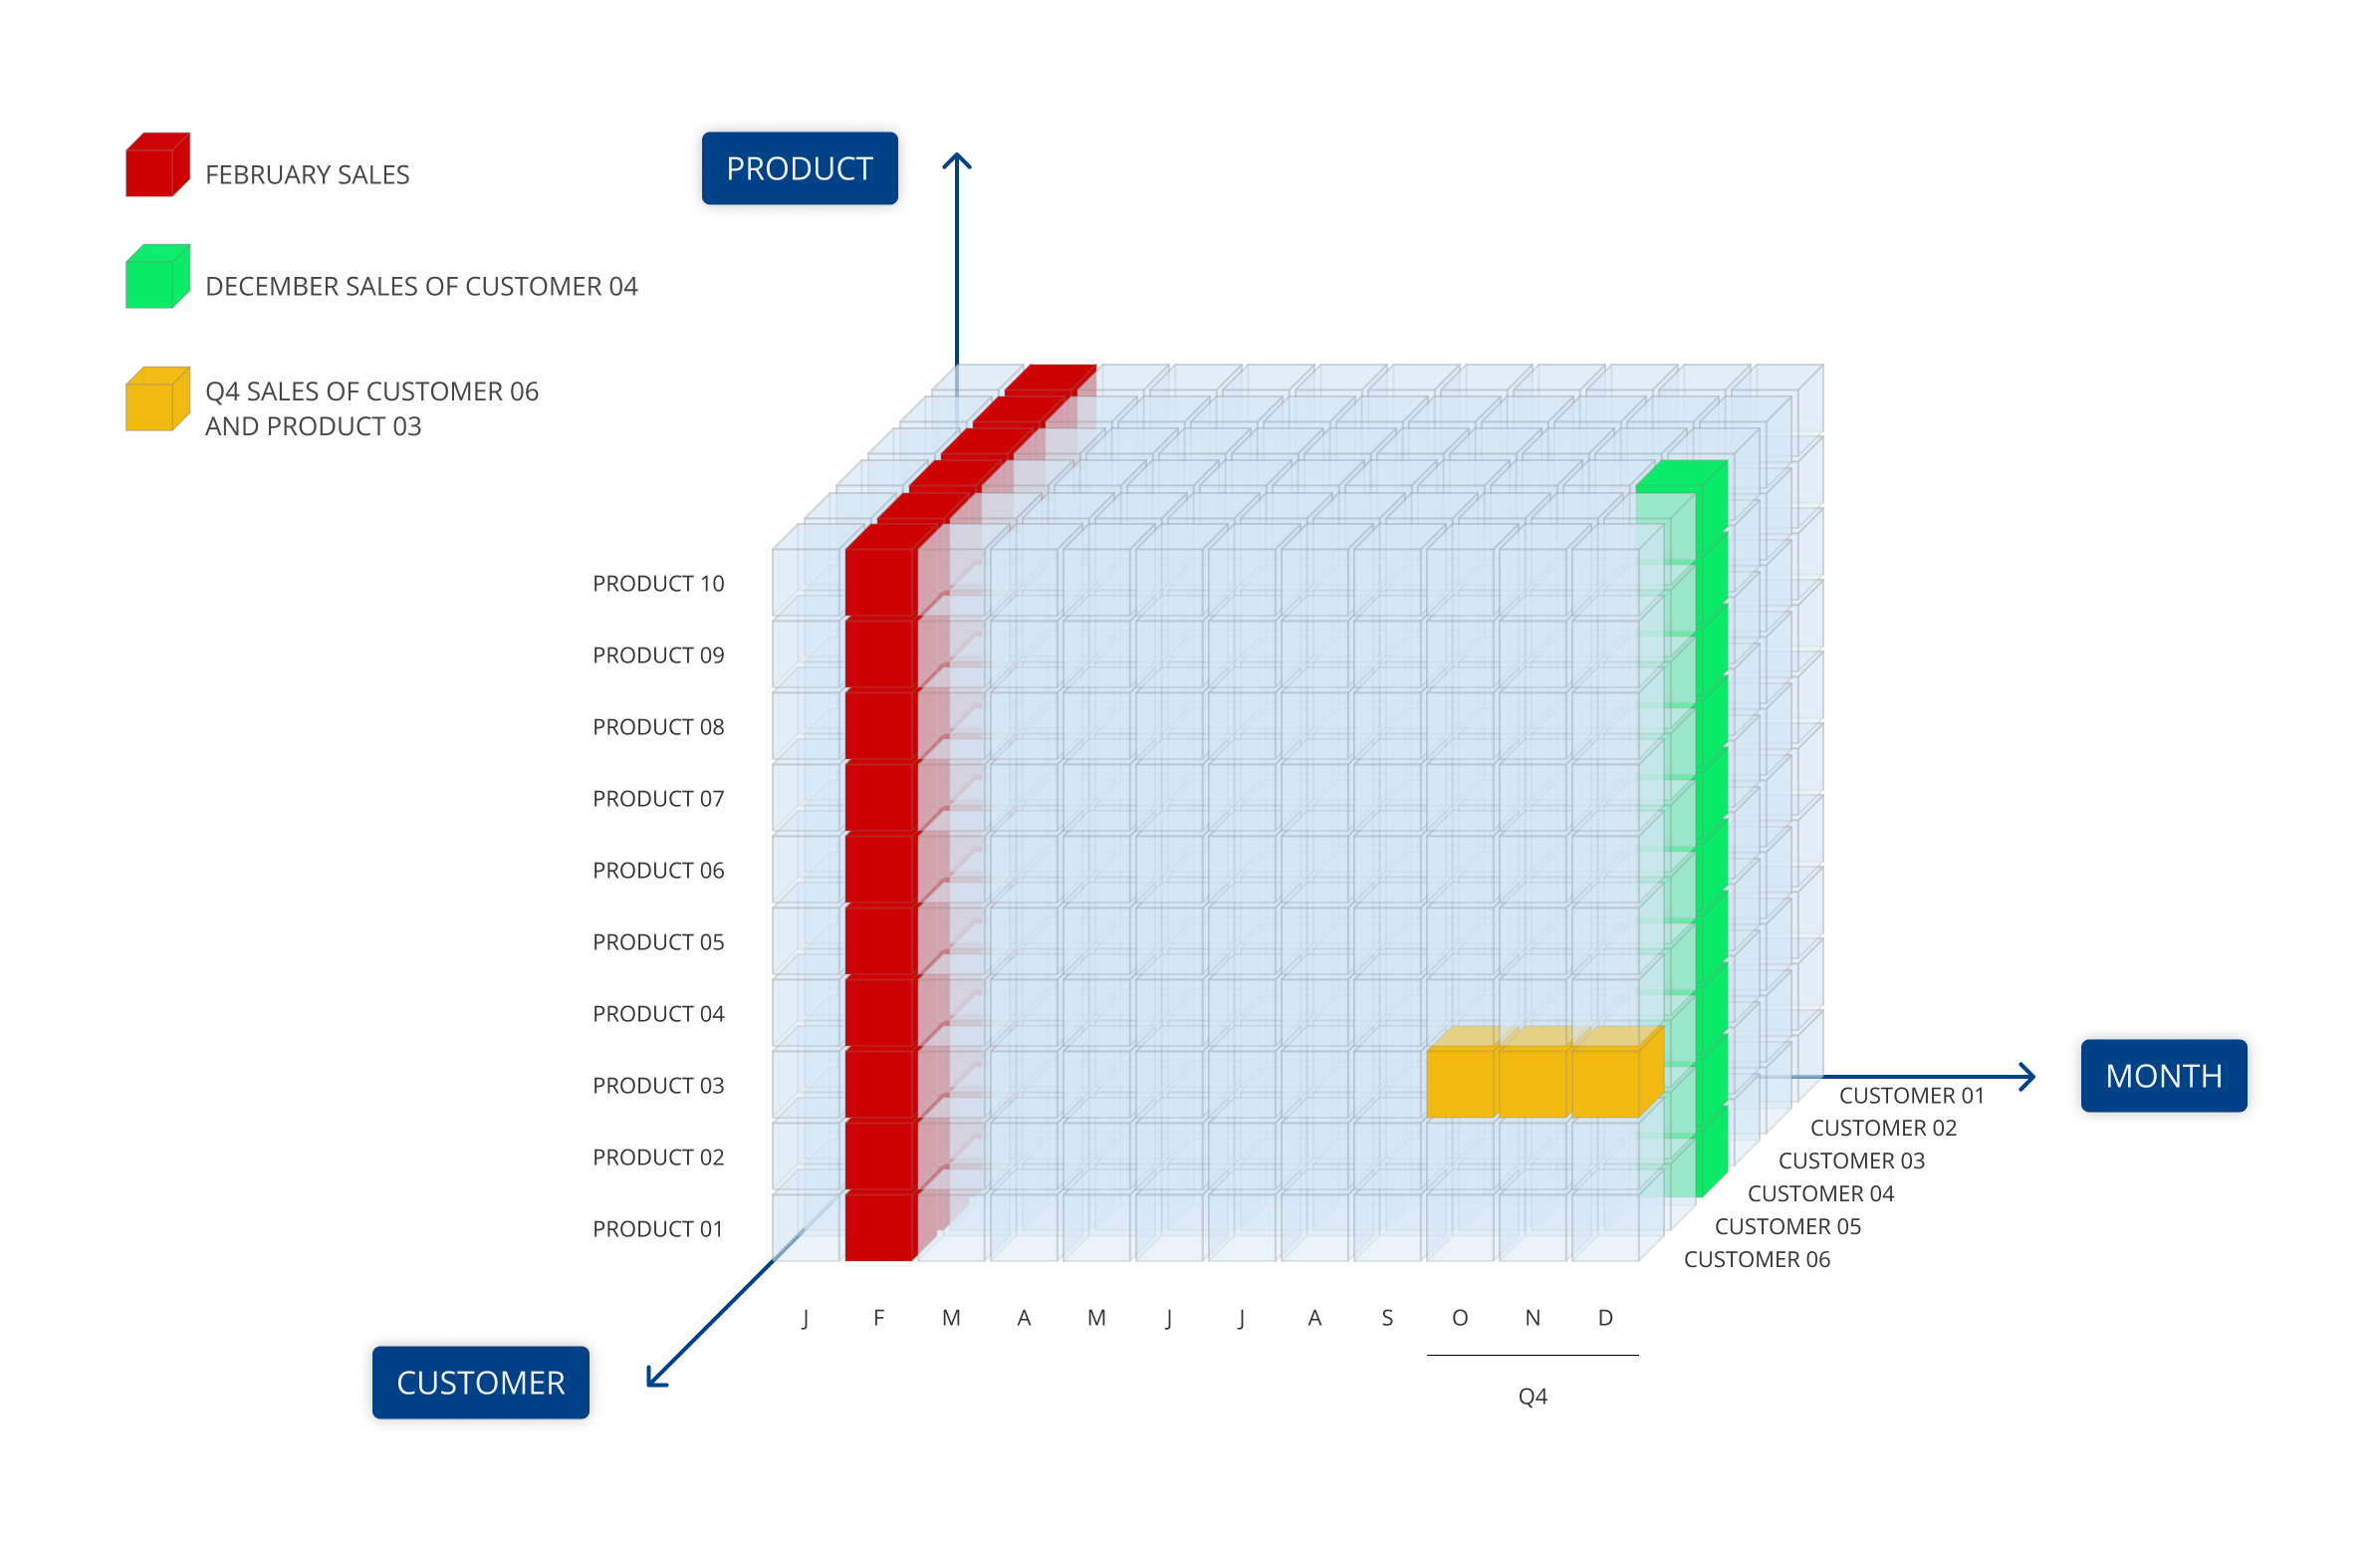
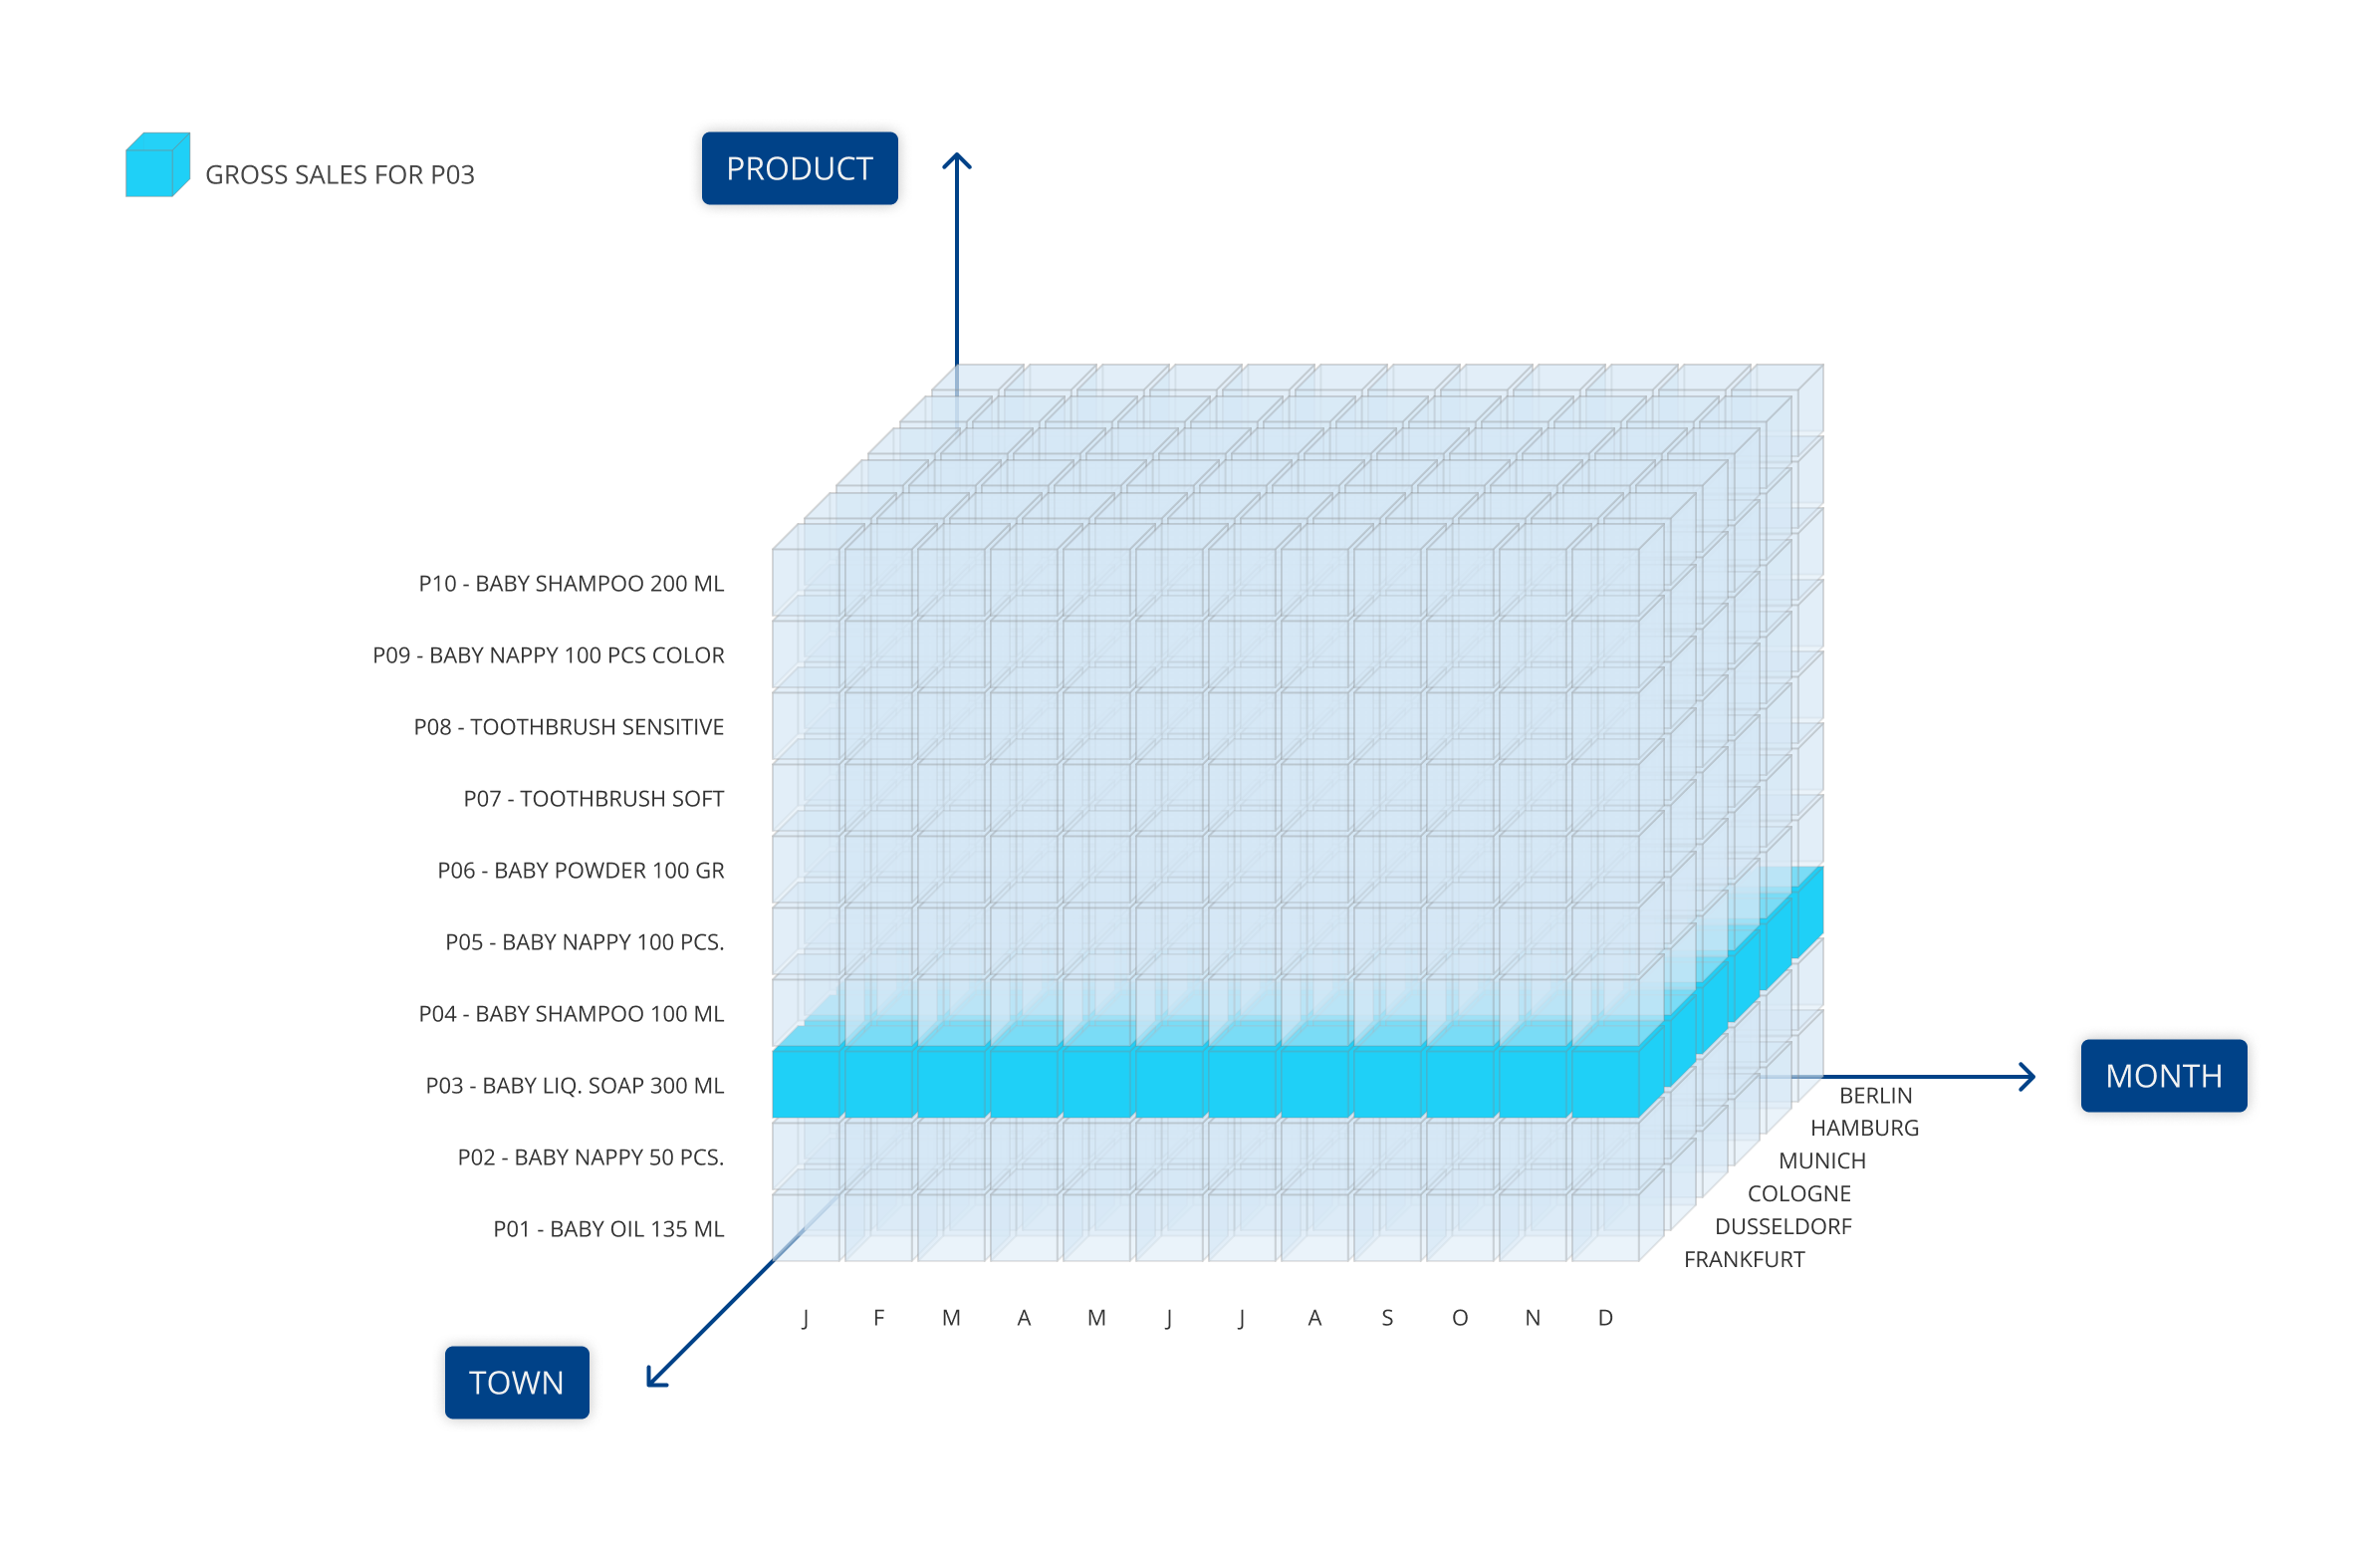
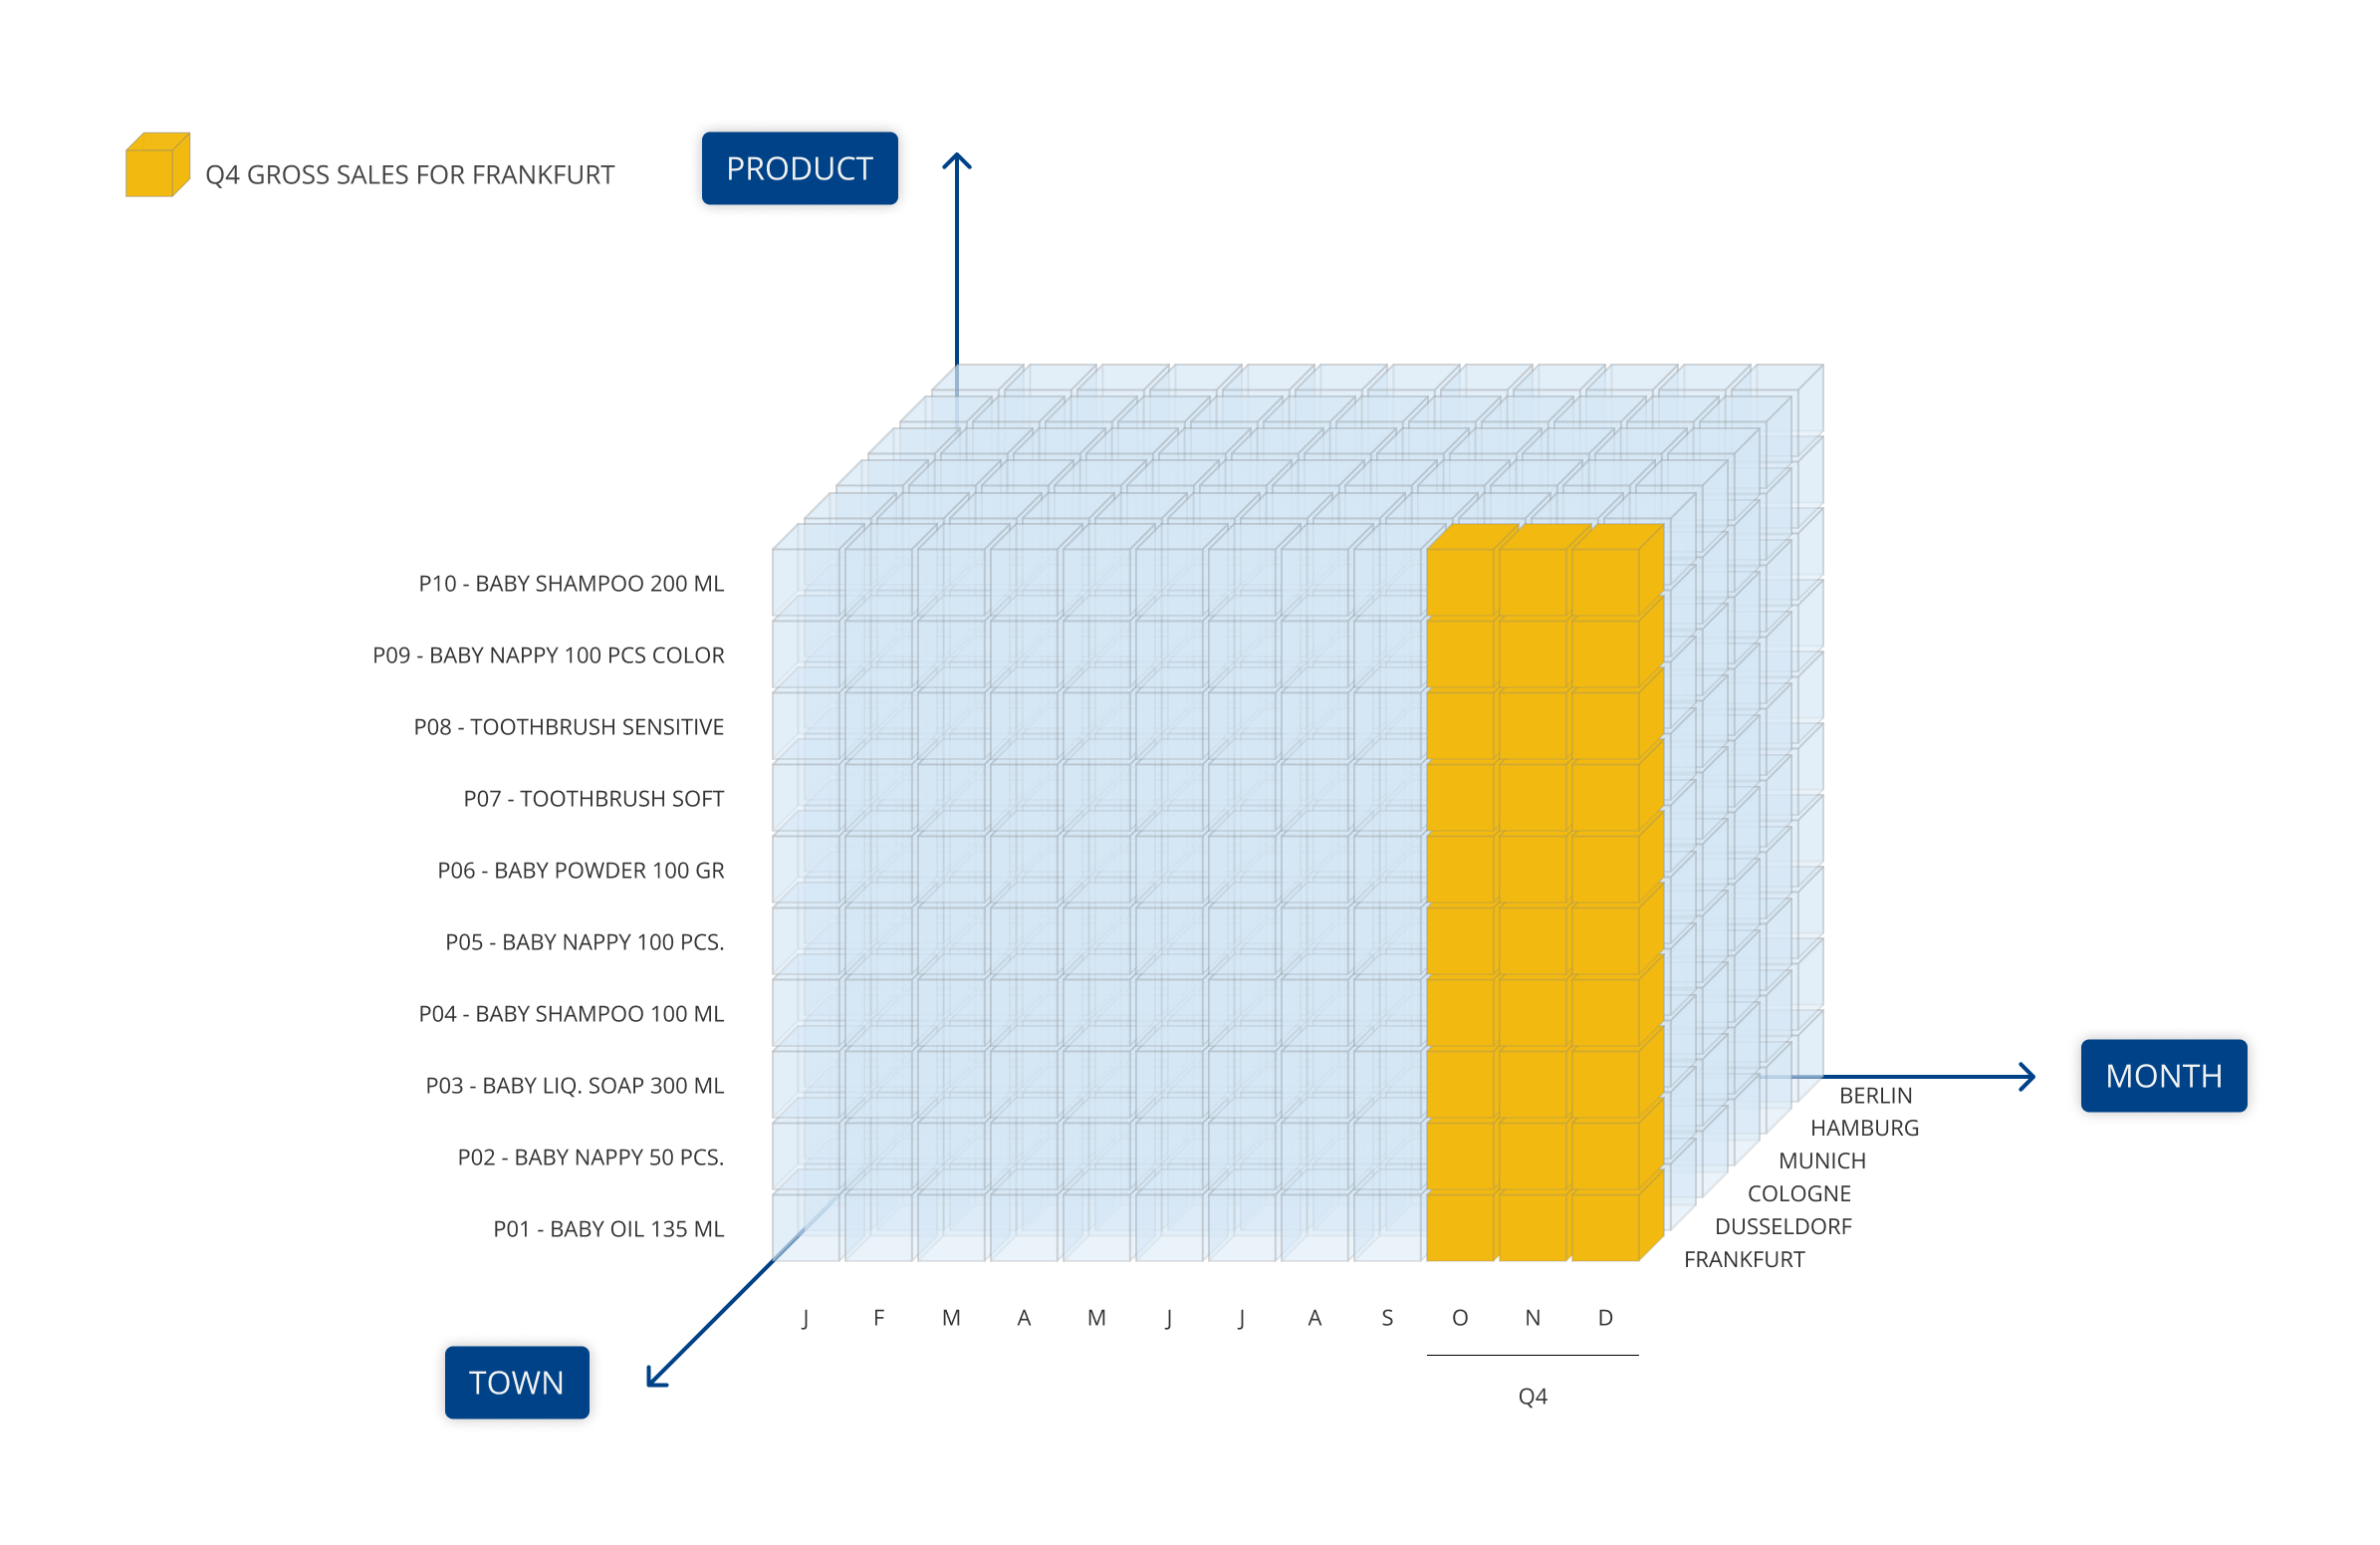
- Cubes: Cubes contain data (often numerical but also text, files, dates and more) that can be analyzed and viewed by its different dimensions and hierarchy levels.
Board organizes and stores data in multidimensional objects called Cubes that are made of cells organized by dimensions. In Board Data models, a dimension is an independent Entity or an entire Relationship that can be used as an axis for a Cube: dimensions categorize and structure data with relation to an area of interest - such as Month, Customer, and Product - to users.
For example, the entity Currency can be a dimension for Cubes such as "Orders value" and "Invoiced value".
Three hierarchically related entities, such as Customer, City, and State, also form a unique dimension, referred to as the Customer dimension: in this scenario, the dimension is named after the base level Entity of the Relationship, the one that represents its most detailed level.
The following tree diagram shows a typical Relationship, where the Customer Entity is related to different Entities belonging to separate branches.
The smallest single item within a Cube is called Cell. Each cell represents the unique logical intersection (coordinate) of one member from every dimension in the Cube.
For example, a "sales" cube, would contain sales values in its cells and could be viewed by various dimensions such as product (i.e. the sales figure per product), geography (i.e. sales figure by country), time and so on.
Entities can be linked through Relationships to establish hierarchical structures (e.g. Product → Product Group → Product Division) that are used to view data at different aggregation levels. Unbalanced Entities are special Entities that can accommodate an entire hierarchical data structure where each element is organized with a parent-child relationship.
Entities, Relationships and Cubes form the multidimensional Data model of the company or, more generally, the modeled system. The modeled system represents each aspect of your business that you want to view and manipulate in Board.
To summarize, the Board Data model is made of:
- Entities: these are information sets, generally text and codes. For example, inside a single Entity there could be a list of Customers, Products or Cities. Entities (and hierarchies) are the Cubes dimensions
- Relationships (hierarchies): when two or more Entities have a many-to-one relation, then a Relationship (or hierarchy) can be defined. For example, the entities Customer, City and State can be organized into the Relationship "Customer → City → State" since there is a many-to-one relationship existing between Customer and City and between City and State
- Cubes: Cubes contain data (often numerical but also text, files, dates and more) that can be analyzed and viewed by its different dimensions and hierarchy levels.
Data model implementation
The main phases of a Data model implementation process are the following:
- Creation of the new Data model and definition of the time range
- Creation of the necessary Entities
- Creation of Hierarchies by defining Relationships between Entities
- Creation of the necessary Cubes
- Loading data into Entities, Relationships and Cubes from your data sources
It's important to follow this very order while creating a new Data model, because each phase depends directly on the previous one: Entities form the structure of each Cube, while Relationships allow you to define a specific level of detail for data stored in Cubes and to query them at a more aggregate level.
Unrelated Entities set as dimensions in Cubes might generate a huge amount of combinations (cells), thus forcing you to load data for each combination: with Relationships, values are calculated implicitly. The absence of Relationships between Entities can also cause inconsistency and unnecessary redundancy of data in Cubes, resulting in incorrect values in your reports.
Once data is imported in a Data model, users can read, write and update Cubes regardless of their data sources.
Board supports write back not only on Cubes, but also directly on relational data sources, making it possible to effectively integrate performance management processes with enterprise applications.
Board provides the capability to connect, integrate and federate data across:
- Relational databases and Data Warehouse(s)
- Enterprise applications (e.g. SAP ERP)
- Multidimensional sources (including SAP BW)
- Web Services via API calls
- Excel, CSV and TXT files
- Cloud based sources
Data is usually imported into Board via Data Readers. Data Readers also handle the mapping of data to Entities, Relationships and Cubes.
Imported data can be later manipulated using Data model procedures.
From a technical point of view, Board leverages the following list of data providers in order to import data from external sources:
- Open Database Connectivity (ODBC) standard and OLE DB to connect with relational databases
- CSV and TXT files