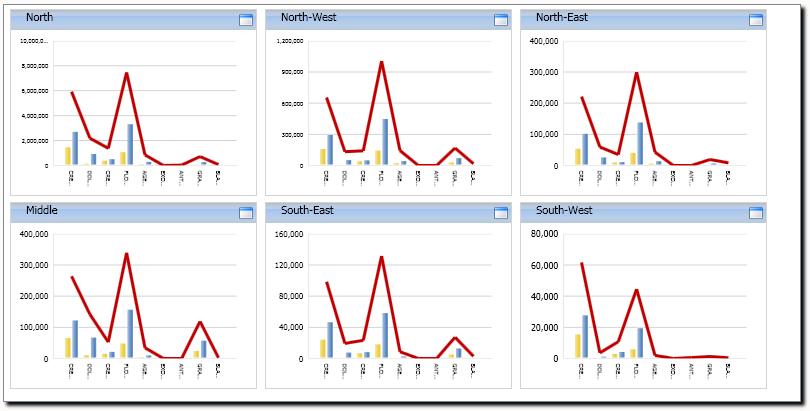
The trellis object is a container that represents another object in a series, such as a series of Charts, across one entity. A trellis chart for example allows to easily compare differences in a series of charts, representing the same data but across one dimension such as different regions, or different periods.
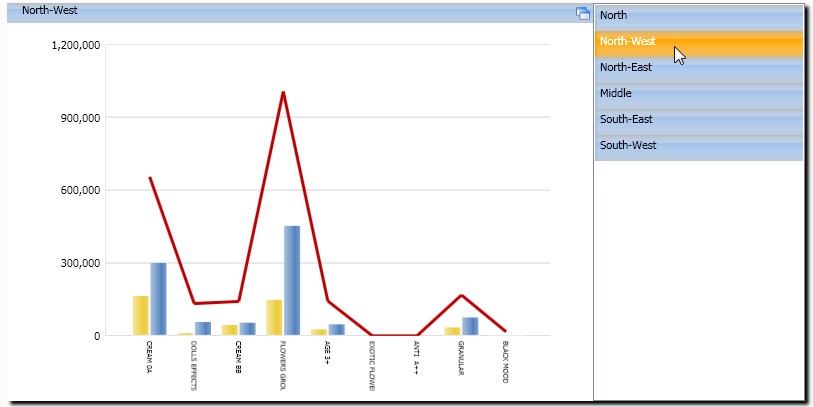
The Trellis object provides an overview representing the series of minimized objects in a grid, but also allows to easily maximise any desired element.
To maximise an item of the trellis click on the maximise icon in the title bar. The chosen item is maximized and on the right the list of other items allows to change the maximized object.
To create a Trellis object,
drag and drop the Trellis object on the screen area,
include another object onto the Trellis. It is possible to include any other object having a layout but it is generally meant for Charts or Bubble Charts.
configure the object included, then go to the Trellis control properties and set the entity by which the series should de generated
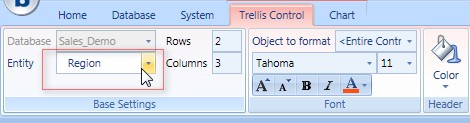
optionally set the number of rows and columns of the grid.
to render the trellis, switch to play mode (press F4). Note that while you're in design mode only a single instance of the object included is visible.
Note:
The number of selected items of the entity used as trellis dimension should be limited to around a dozen, considering that each instance generates a Layout and the rendering of each instance requires graphical processing.