The chart object provides the following interactive features,
Master Layout
Drill-down
Drill-to screen
Experimental rotation (on 3D charts only)
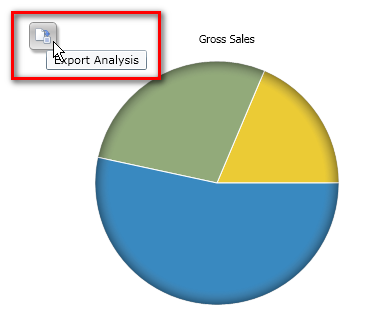
Export
You might be interested in reading about the Client Chart Object.
If the Layout of the chart has been defined as Master Layout (refer to Creating a chart), left-click on an element of the chart (a bar, a line or a sector of a pie chart) will refresh the data displayed by all other objects of the screen, with a restriction to the item clicked.
When the Master option is enabled, the drill-down function is disabled.
Left click on an element of the chart (a bar, a line or a sector of a pie chart) to drill-down on the selected item.
It is possible to drill-down from one Chart row to another screen within the same Capsule: click on an element of the chart (a bar, a line or a sector of a pie chart): the selected target screen will be opened with a selection on the item clicked. This feature allows to nest analysis in a more powerful way than the standard drill-down which fundamentally only changes the level of granularity of one report, in a drill-to screen navigation the data represented (values, indexes) and types of objects (charts, dashboards, grids) may vary as the user drills from a top level view to another screen, more detailed.
Place the mouse over the chart object, then press ann hold the left button of the mouse and move the mouse to rotate the chart.
These options are available on 3D charts only.
Please note that this feature is experimental.
The Chart data can be exported to a Microsoft Excel file or an HTML or XML file: click on the Export icon and select the desired file format.