1 Introduction
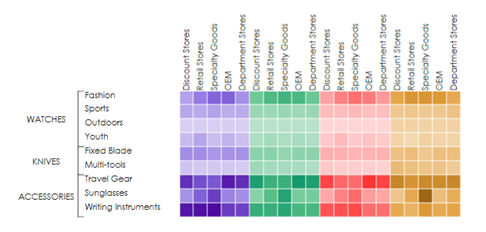
The HEAT MAP is a graphical representation of data where the individual values contained in a matrix are represented as colors.
Heat maps originated in 2D displays of the values in a data matrix. Larger values were represented by small darker squares (pixels) and smaller values by lighter squares.
2 How to create and use a Heat-map Object
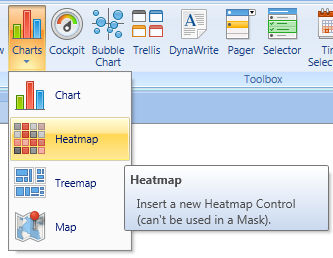
Click on charts icon and drag & drop into your screen the Heatmap Object
Right click on the object to open layout and insert Data you need
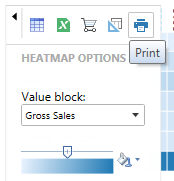
Setup the Axis accordingly to the Heat-map granularity (Squares) you like.
NOTE
You can use unlimited Entities by Row : If there are two entities by Row, the User can change the orientation of first entity by clicking on the bottom ROTATE LABELS available in the Heat-map Option Bar (while in Edit mode)
You can use up to one entity by column
Click on the option tab and drag and drop the Layout blocks.
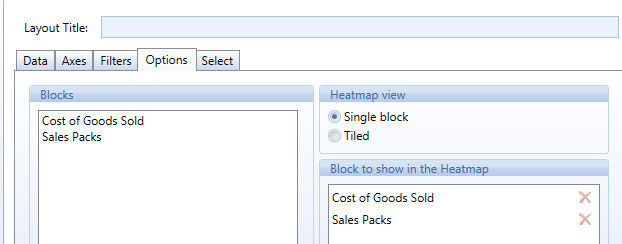
Base on the blocks to show in the heat-map you can have
|
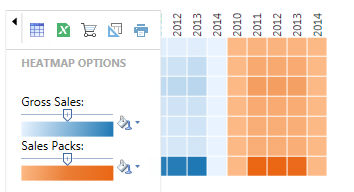
Single Block: The Heatmap displays one single block per time. From the drop down list on the left you can scroll among the available blocks and change it on the fly. |
|
Tiled Block: The Heatmap displays multiple blocks . From the drop down list on the left you can scroll among the available blocks and change thier color coding on the fly. |
NOTE
The Heat map supports the Master Layout and Drill Down options;