Data View and Chart enhancements
The Data View and Chart Objects in Board 2021 Summer release offer new features and improvements for an even deeper level of customization.
Here's a summary of what has changed.
Data View Object
- Data View Freeze Panes. This feature keeps an area of the Data View visible while you scroll to another area of the Object. The new feature is available in Play mode by clicking on the contextual menu icon (
 ) and in Design mode in the "TABLE STYLE" menu under the Data View properties.
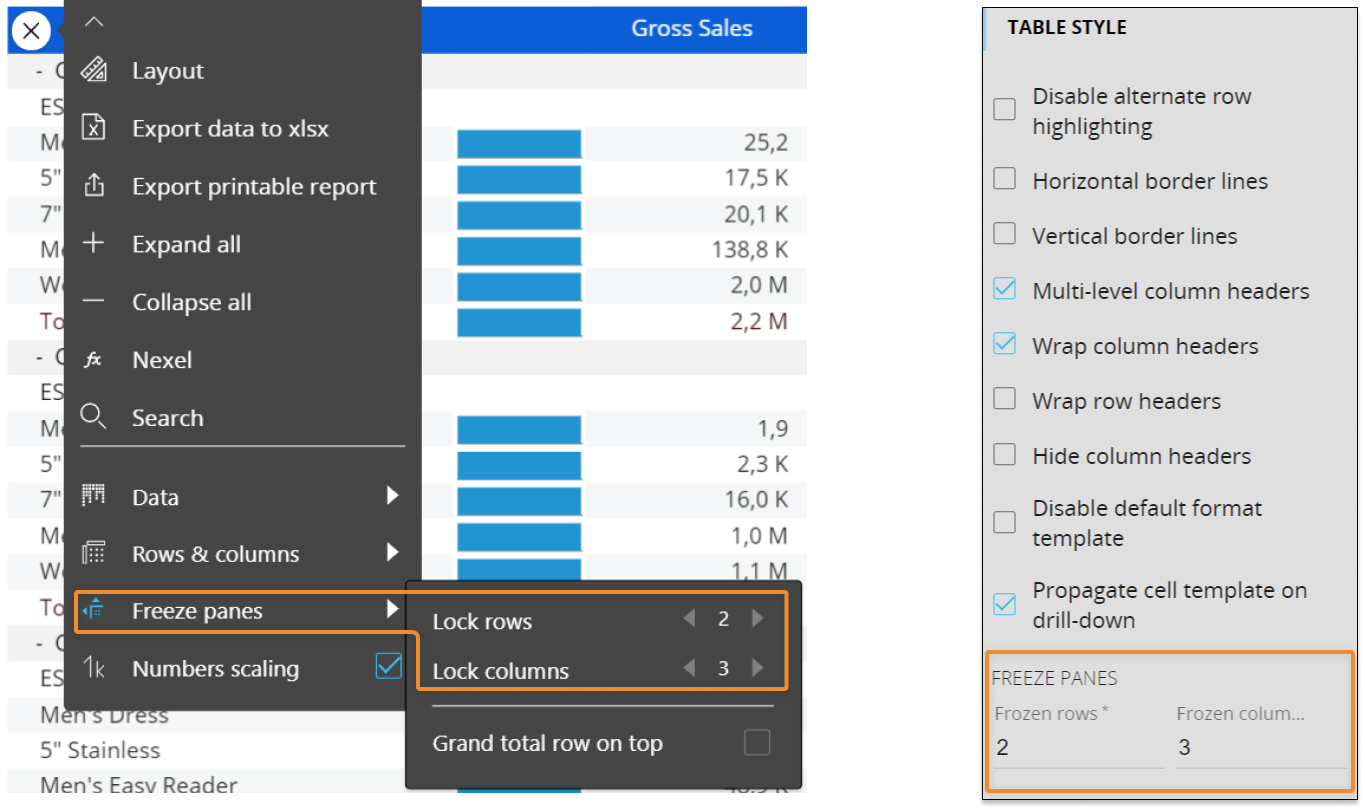
The Freeze Panes feature always locks rows and columns starting from the top left corner of the Data View. The configuration shown above, locks the first two rows on top and the three leftmost columns of the Data View, resulting in a locked area made of six cells.Row and Column headers, Sparklines and totals aligned to the the left are locked by default and cannot be unlocked.
- Column Header underline. It is now possible to add an underline to column headers of the Data View. The underline can be completely customized and developers can define:
- The underline height
- The columns to underline
- A fill pattern for the underline
- A color for the underline
- A border for the underline and the border's color

The underline formatting options are available in Design mode under the "COLUMNS" menu in the Data View properties - New visualization options for Total and Grand Total rows. It is now possible to show or hide the Total and Grand Total rows of a Data View, display only the Grand Total row or place it on top. These options are available in Design mode under the Data View properties
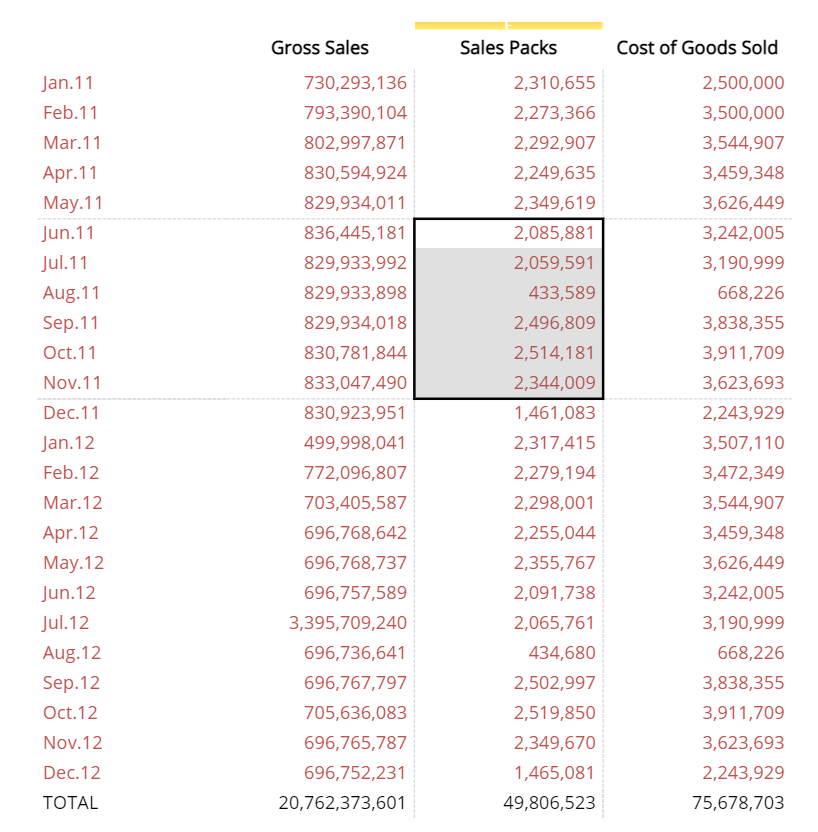
- Selected cells highlight. When you select one or more cells of a Data View, a set of dashed lines will highlight rows and columns affected by the selection
- Improved management of 0 and empty values. Board can now handle 0 and empty values differently when these values are entered with a data-entry action. To do so, the "Differentiate zero and null" option must be enabled under the Object properties menu in the Layout editor.
When this option is active, the Data View will show:- An empty cell when no value is entered by the user
- The number 0 when the 0 value is entered by the user. To save the 0 value entered by the user, the "Hide zeroes" option must be enabled on the Data blocks In the Layout editor
- Custom BLOB cubes. BLOB cubes that contain files that are not automatically recognized will be displayed with a custom icon showing the file extension. The file extension is automatically recognized during the cube configuration, however users can manually enter any extension they want
Chart Object
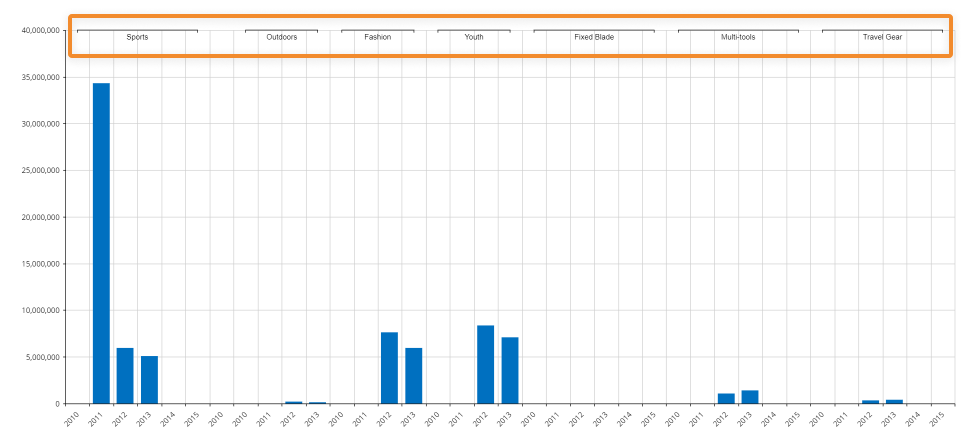
- Entity grouping. When two Entities are placed in the Categories axis in the Layout editor, the least nested one is shown on top of the Chart. If more than two Entities are placed in the Categories Axis, only the least nested one and the most nested one are considered
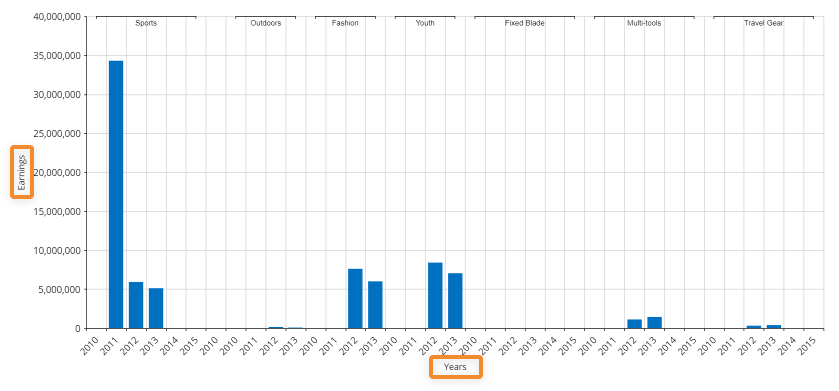
- Axes titles. It is now possible to add a custom title (label) to each axis (Category axis, Primary Y axis and Secondary Y axis). The new option is available in Design mode in the "AXIS" menu under the Chart properties
- Axes labels angle. Developers have more rotation angles to choose from, when managing the angles of axes labels. The new options are available for the Category, Primary Y and Secondary Y axes and can be reached in the "AXIS" menu under the Chart properties in Design mode
- New formatting options. The following formatting options are now available:
- Fill patterns and border formatting for data series of a Bar Chart. The series of a Bar Chart can now be customized with various fill patterns. Developers can also customize width and color of the series borders. The new options are available in Design mode in the "SERIES" menu under the Chart properties
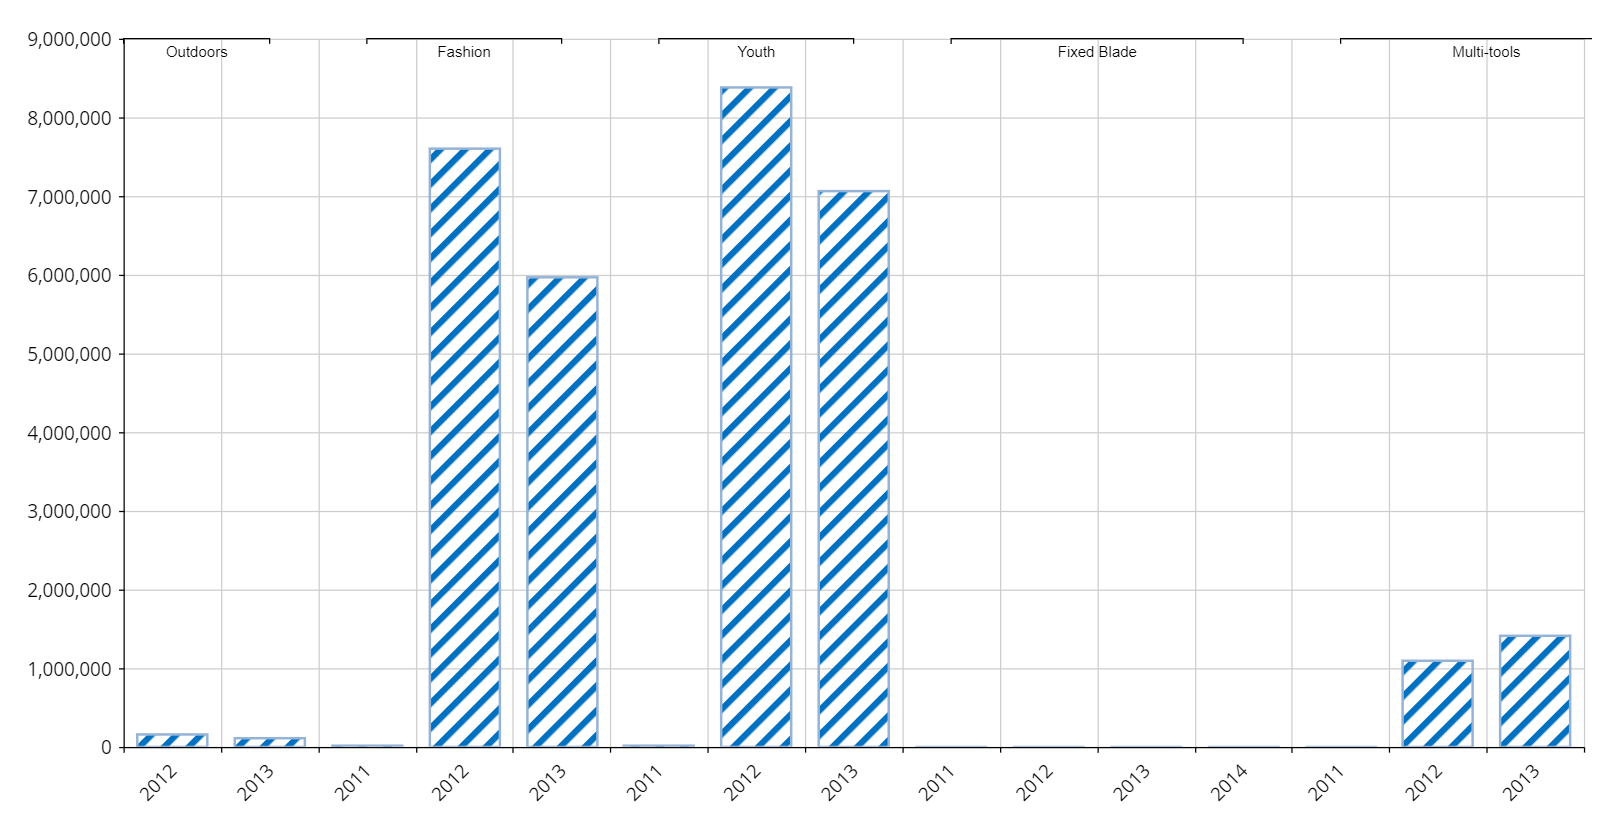
- Line width. Developers can manage the line width in Line, Spline and Step line Charts. The new option is available in Design mode in the "SERIES" menu under the Chart properties.
- Fill patterns and border formatting for data series of a Bar Chart. The series of a Bar Chart can now be customized with various fill patterns. Developers can also customize width and color of the series borders. The new options are available in Design mode in the "SERIES" menu under the Chart properties