The Logs section
This topic describes the layout of the Logs section of the Data model and the information it provides.
From the Logs home page you can review various information about actions performed on the Data model, obtained from the standard Data model logs.
After clicking on the “Logs” tile in the “Data model” section of the desired Data model, you will be taken to the Logs page, which is divided into the following four sections that you can access via the tabbed menu at the top.
- OPERATIONS. Here you can see a table containing each action performed on the Data model, either manually or by some Procedure steps.
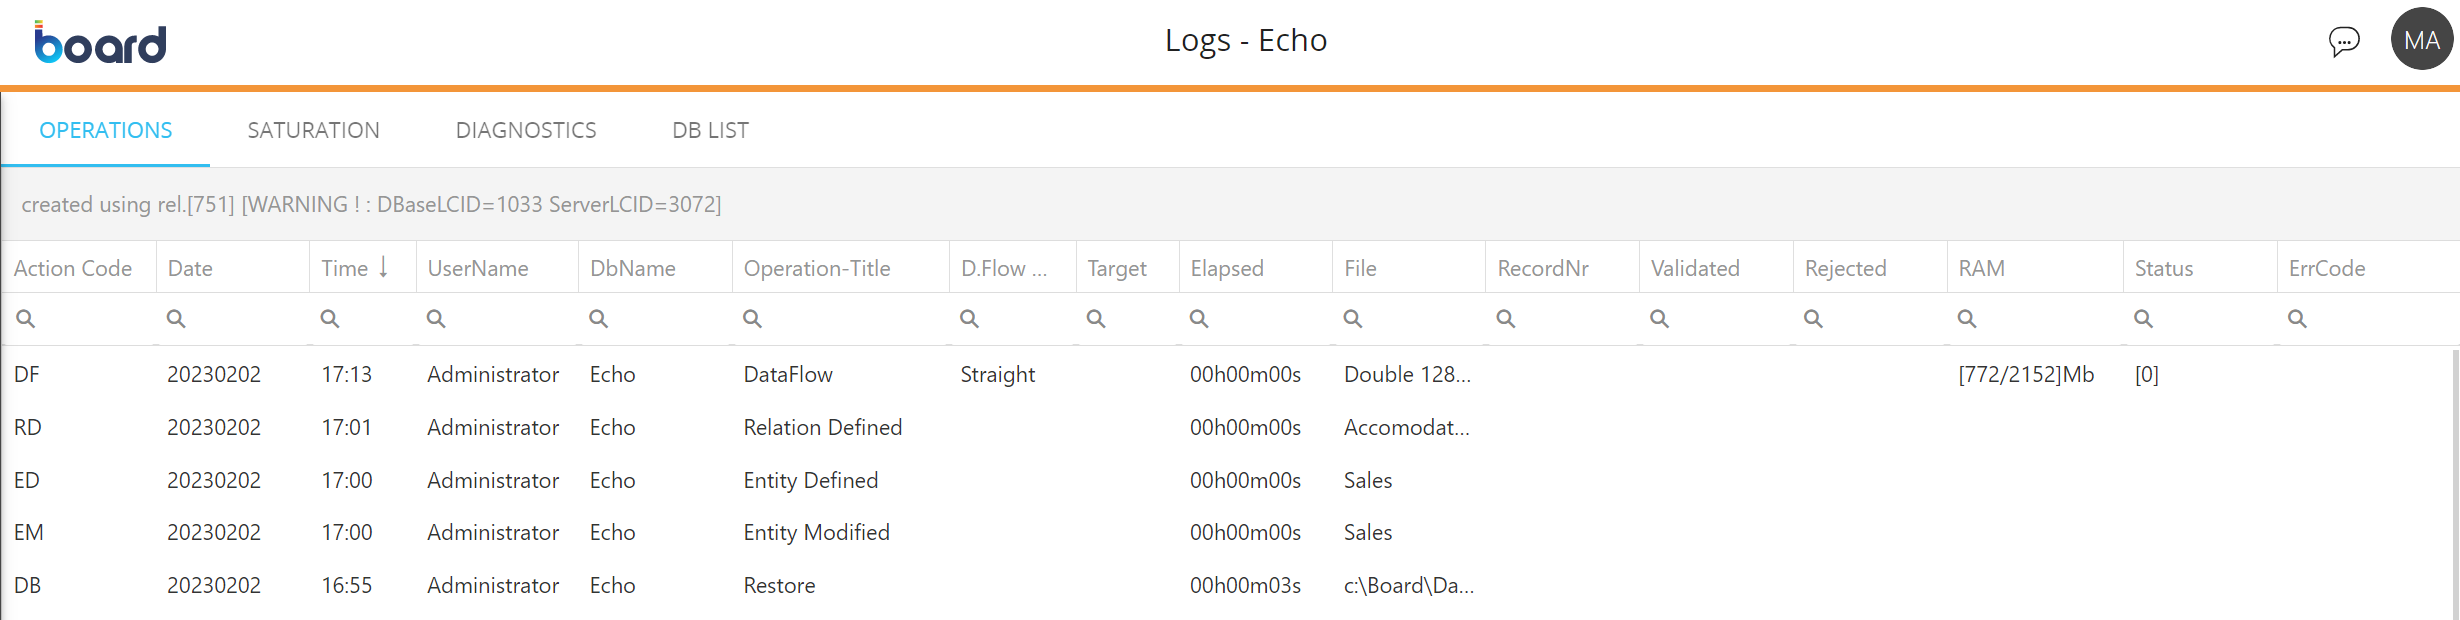
The table is sortable and searchable using the interactive header fields. It is divided into the following columns, which contain information about the action performed:- Action Code: Each action has a specific action code made up of two letters, which usually are the initials of the action found in the Operation-Title column (i.e. the code for the action “Entity Modified” is “EM”). Note that this is not always the case, for example, the action code for a Data reader action is “FR”.
- Date: The date on which the action was performed, displayed in the following format: YYYYMMDD (i.e. an action performed on the 23rd of January 2023 will be logged with the date “20230123”)
- Time: The time at which the action was performed, displayed in the following format: HH:MM (i.e. 10:15)
- UserName: The user name of the Board user who performed the action
- DbName: The name of the Data model on which the action was performed
- Operation-Title: The name of the action performed (i.e. if an Entity has been modified, the name of that action will be “Entity Modified”). Note that this is not always the case, for example, the Operation-Title for a Data reader action is the name of the Data reader protocol
- D.Flow Mode: The name of the Dataflow execution mode (i.e. the Dataflow algorithm used for the calculations). This column contains information only about Dataflow actions
- Target: The name of the target of the action. Depending on the type of action, this field can contain different information, such as the name of a target Cube of a Dataflow action, the name of an ASCII file imported by a Data reader protocol, etc.
- Elapsed: The time it took to perform the action, displayed in the following format: HHhMMmSSs (i.e. "00h01m23s")
- File: Name of the resource on which the action has been performed. Depending on the type of action, this field can contain the names of different resources, such as the name of an Entity, the name of a Cube, the path and name of a Data model backup or restore file, etc.
- RecordNr: Number of records read by a Data reader protocol
- Validated: Number of records validated by a Data reader protocol
- Rejected: Number of records rejected by a Data reader protocol
- RAM: Information about the quantity of RAM used by an action, displayed in the following format: [UsedRAM/TotalRAM]Mb (i.e. "[4050/28000]Mb")
- Status: Status of the action performed
- ErrCode: The error code in case the action fails.
The same information is contained in the Log files that are generated in the following path: Board\Dataset\Log\
The log files have the following name format: HBMP_DatamodelName_YYYYMM.log (for example, "HBMP_MyDatamodel_202302.log").
The Log file is rolled at the end of each month.Please note that the log is generated only if the “Database Log Events” option is enabled in the “Log settings” section of System Administration.
-
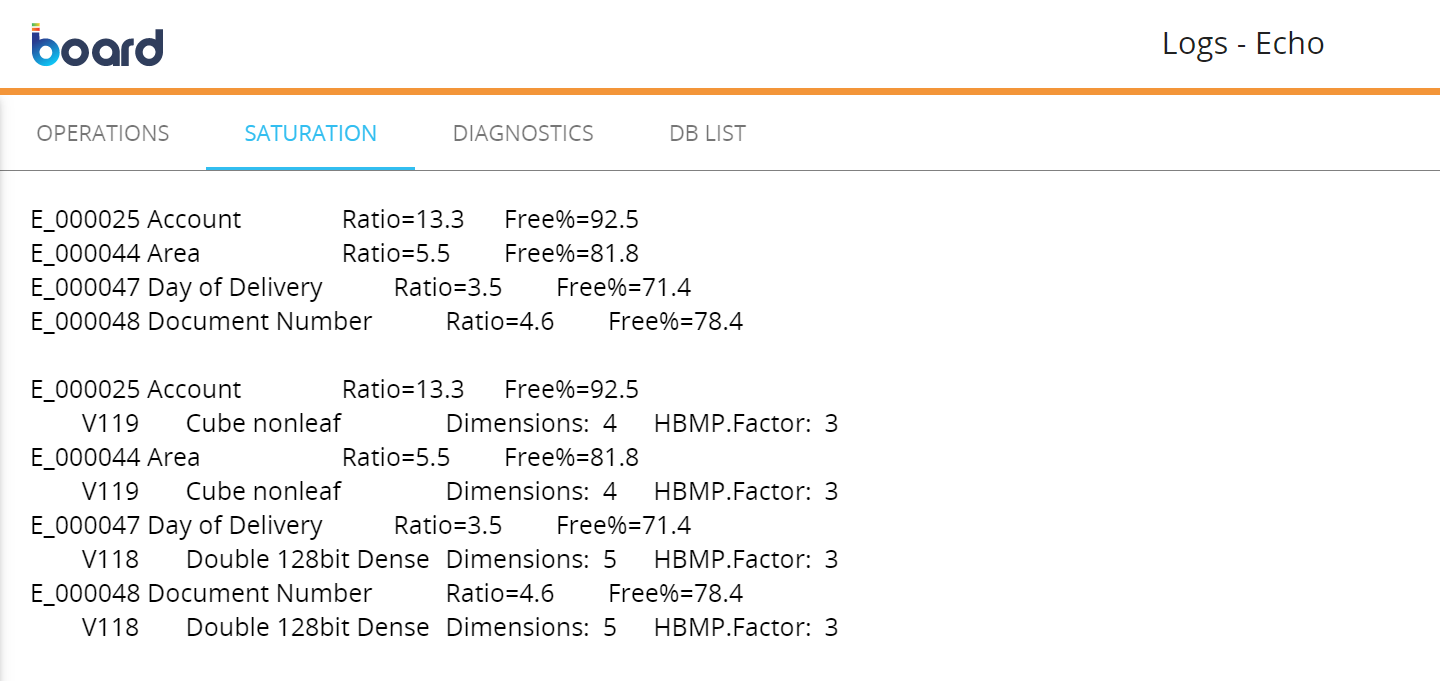
SATURATION. Here you can see details of Entities and Cubes that have those Entities in their Structure, if limitations on the number of members are found. This usually happens when the “Max Item number” property of an Entity is set to "auto" and that Entity is a dimension of a Cube with a very sparse structure.
-
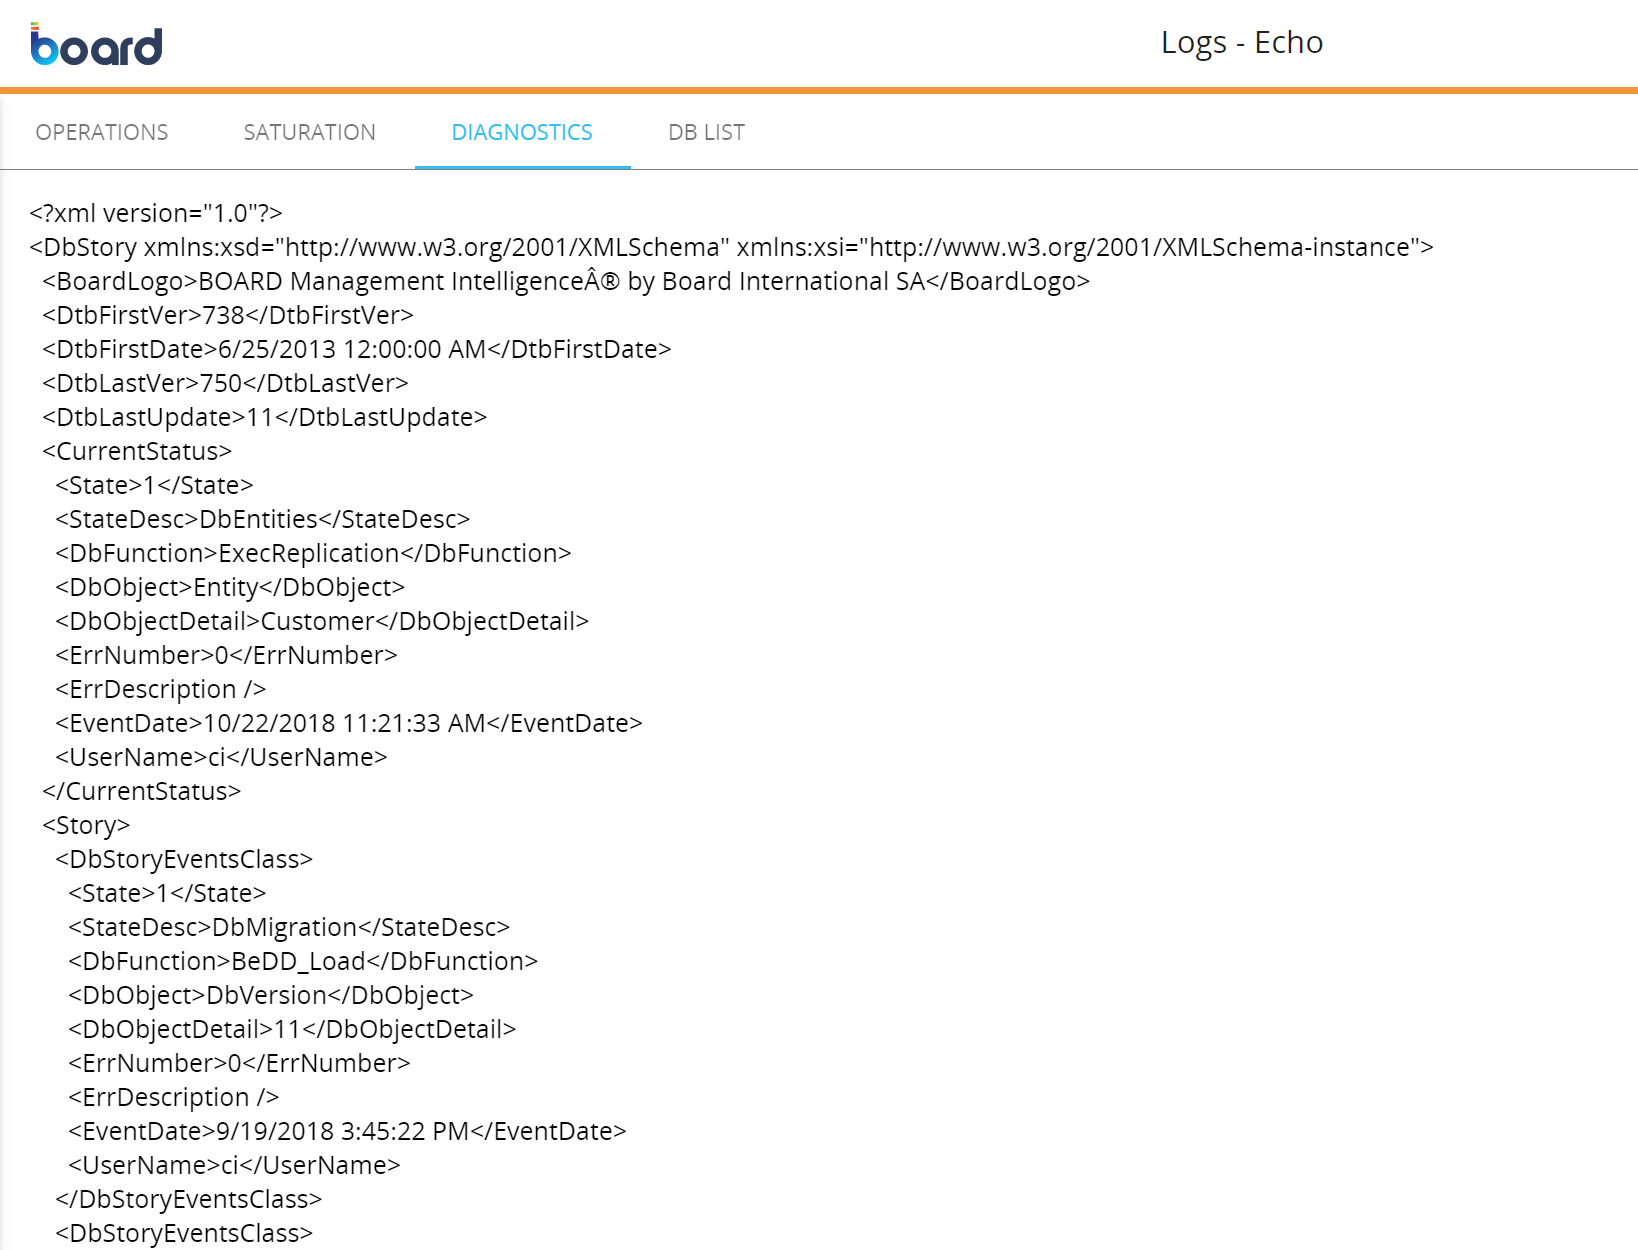
DIAGNOSTICS. Here you can see various diagnostic details of the Data model in XML format.
-
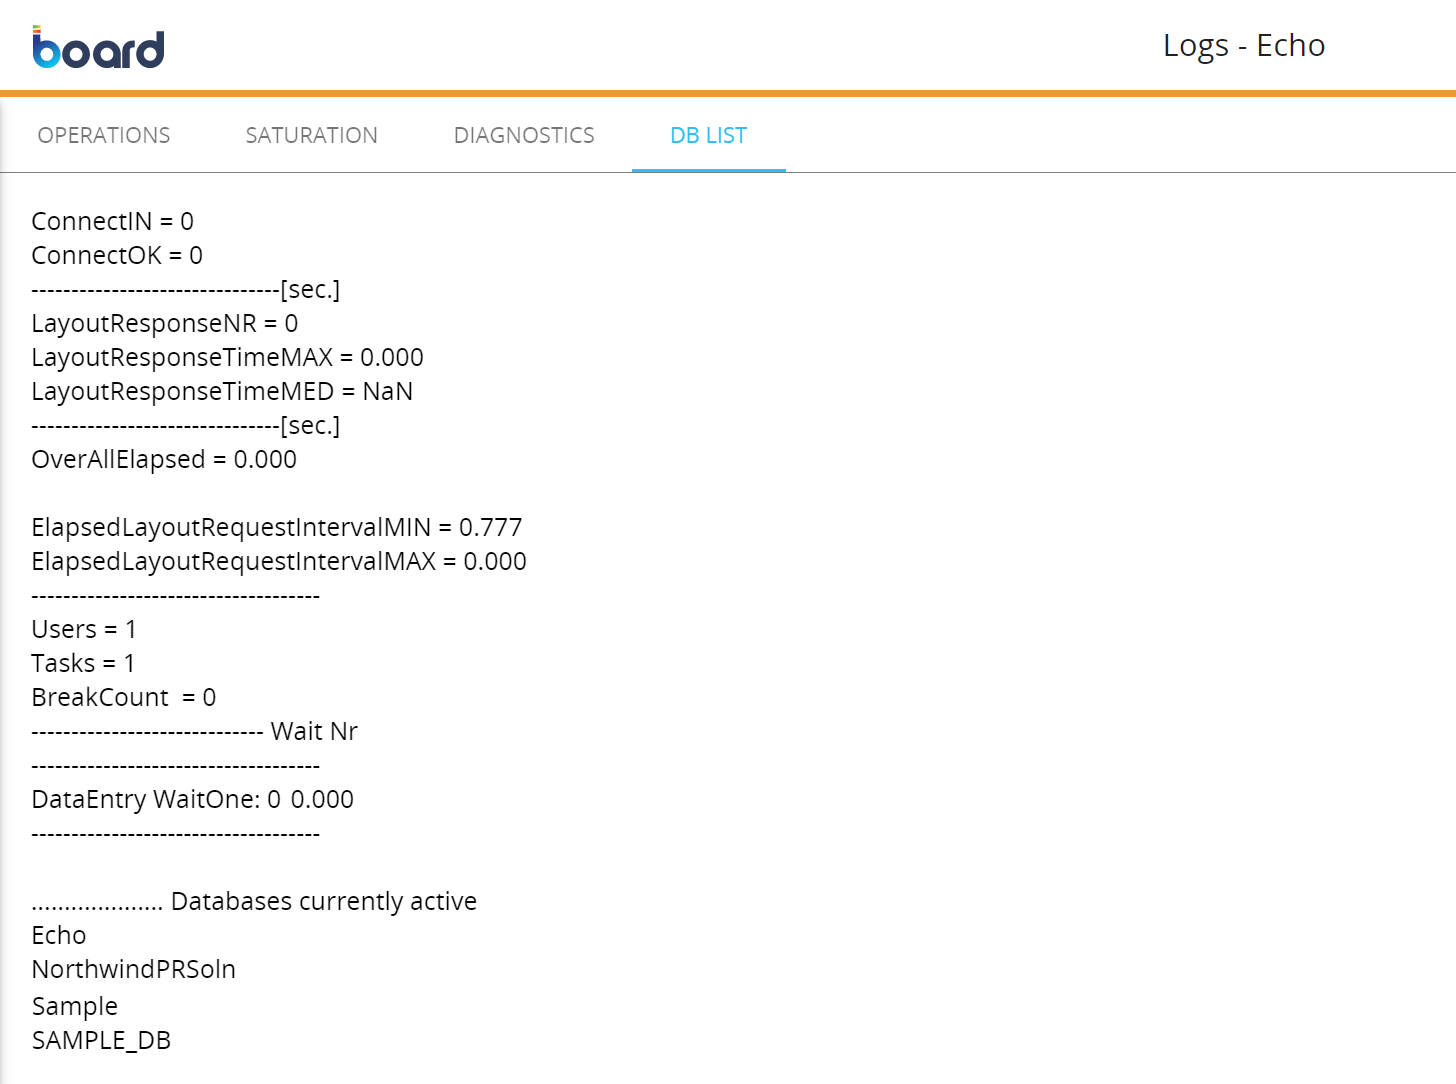
DB LIST. Here you can see a full list of the Data models that are currently active, i.e. loaded in the Platform memory (RAM).
Along the list of active Data models, here you can also find other miscellaneous information about the Data model, such as the number of active users, tasks, and the Layout response time.