The B.E.A.M. Forecasting section
This topic describes the B.E.A.M. Forecasting section of the Data model.
The B.E.A.M. Forecasting section allows you to configure forecast scenarios that automatically fill a target Cube with probable future values based on a historical data set that you feed to the forecast scenario.
To access the B.E.A.M. Forecasting section, access the designer space of the desired Data model and click on the B.E.A.M. Forecasting tile. You will be taken to the B.E.A.M. Forecasting page.
The user must have an appropriate Board license to be able to view and access the B.E.A.M. Forecasting tile.
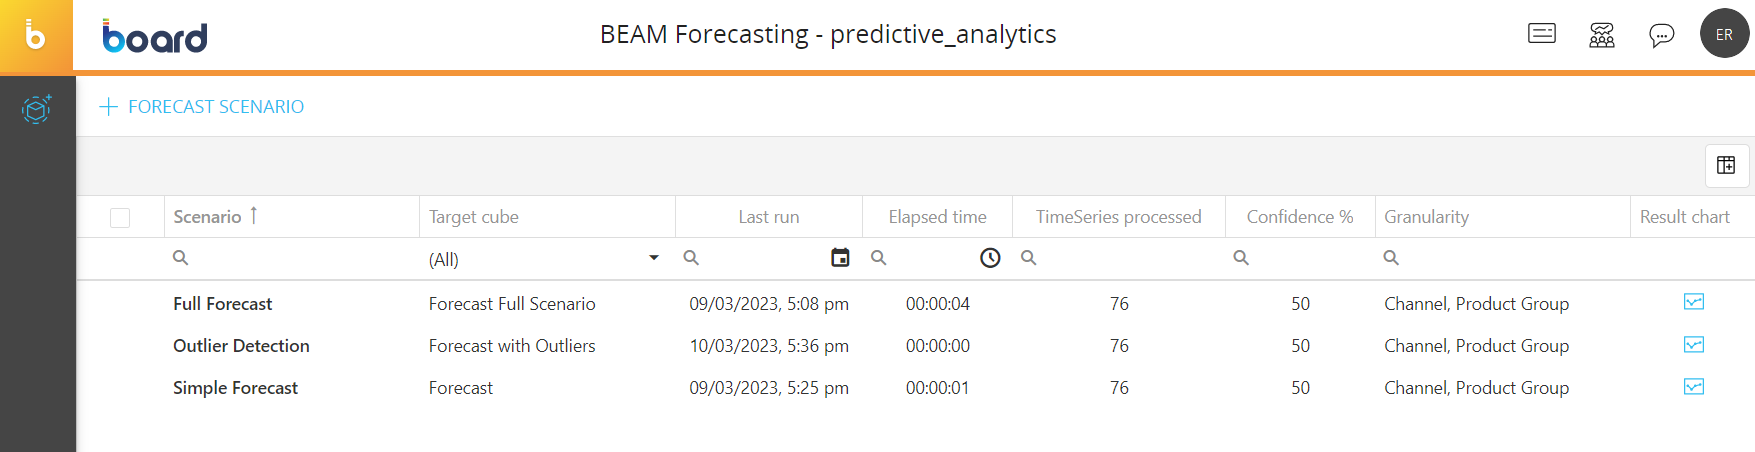
In the B.E.A.M. Forecasting page you can see all existing forecast scenarios and their main information: the table is sortable and searchable using the interactive header fields. You can also show or hide columns to your liking, by clicking the Column chooser button in the upper right corner of the table.
The table contains the following information:
- Scenario. This column displays the name of each forecast scenario
- Target Cube. This column displays the name of the target Cube where the forecasted data for each scenario will be stored
- Last run. This column displays the date and time of the last run of each forecast scenario, in the following format: DD/MM/YYYY HH:MM
- Elapsed time. This column displays the time it took to run each forecast scenario, in the following format: HH:MM:SS
- TimeSeries processed. This column displays the number of time series processed by each forecast scenario
- Confidence %. This column displays the value entered in the "Confidence %" field of each forecast scenario
- Granularity. This column displays the granularity (the Structure) of the target Cube for each forecast scenario
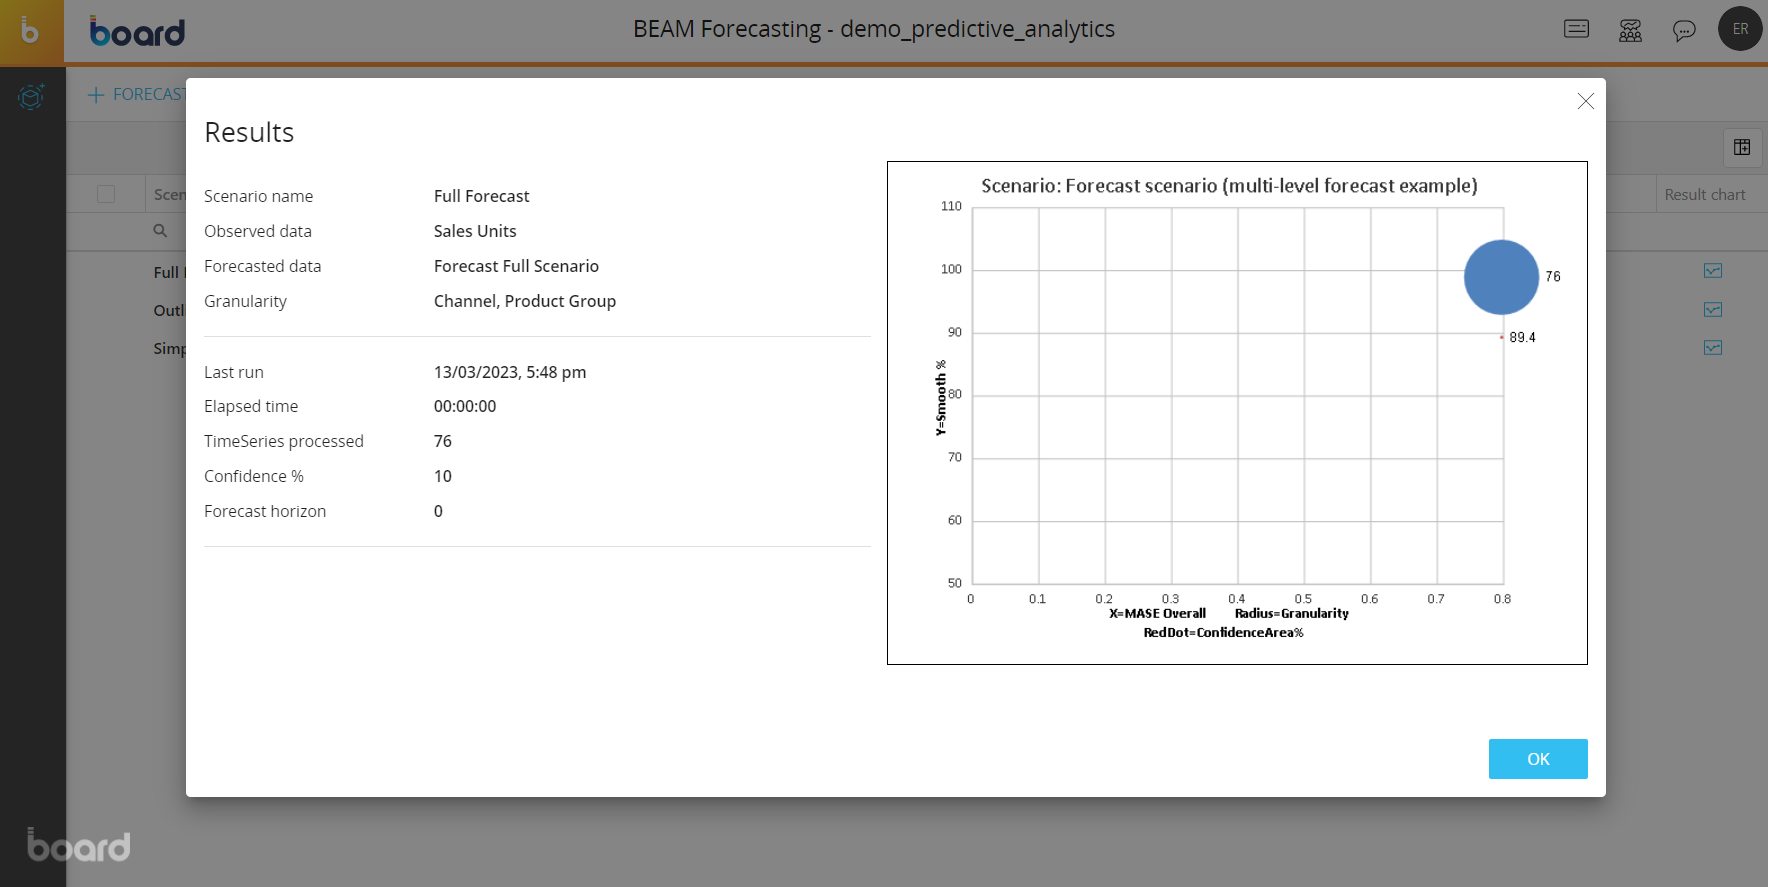
- Result chart. This column displays a button for each scenario. Click it to see the results of the corresponding forecast scenario after running it at least once, as shown in the image below.
Creating a Forecast Scenario
To create a forecast scenario, proceed as follows:
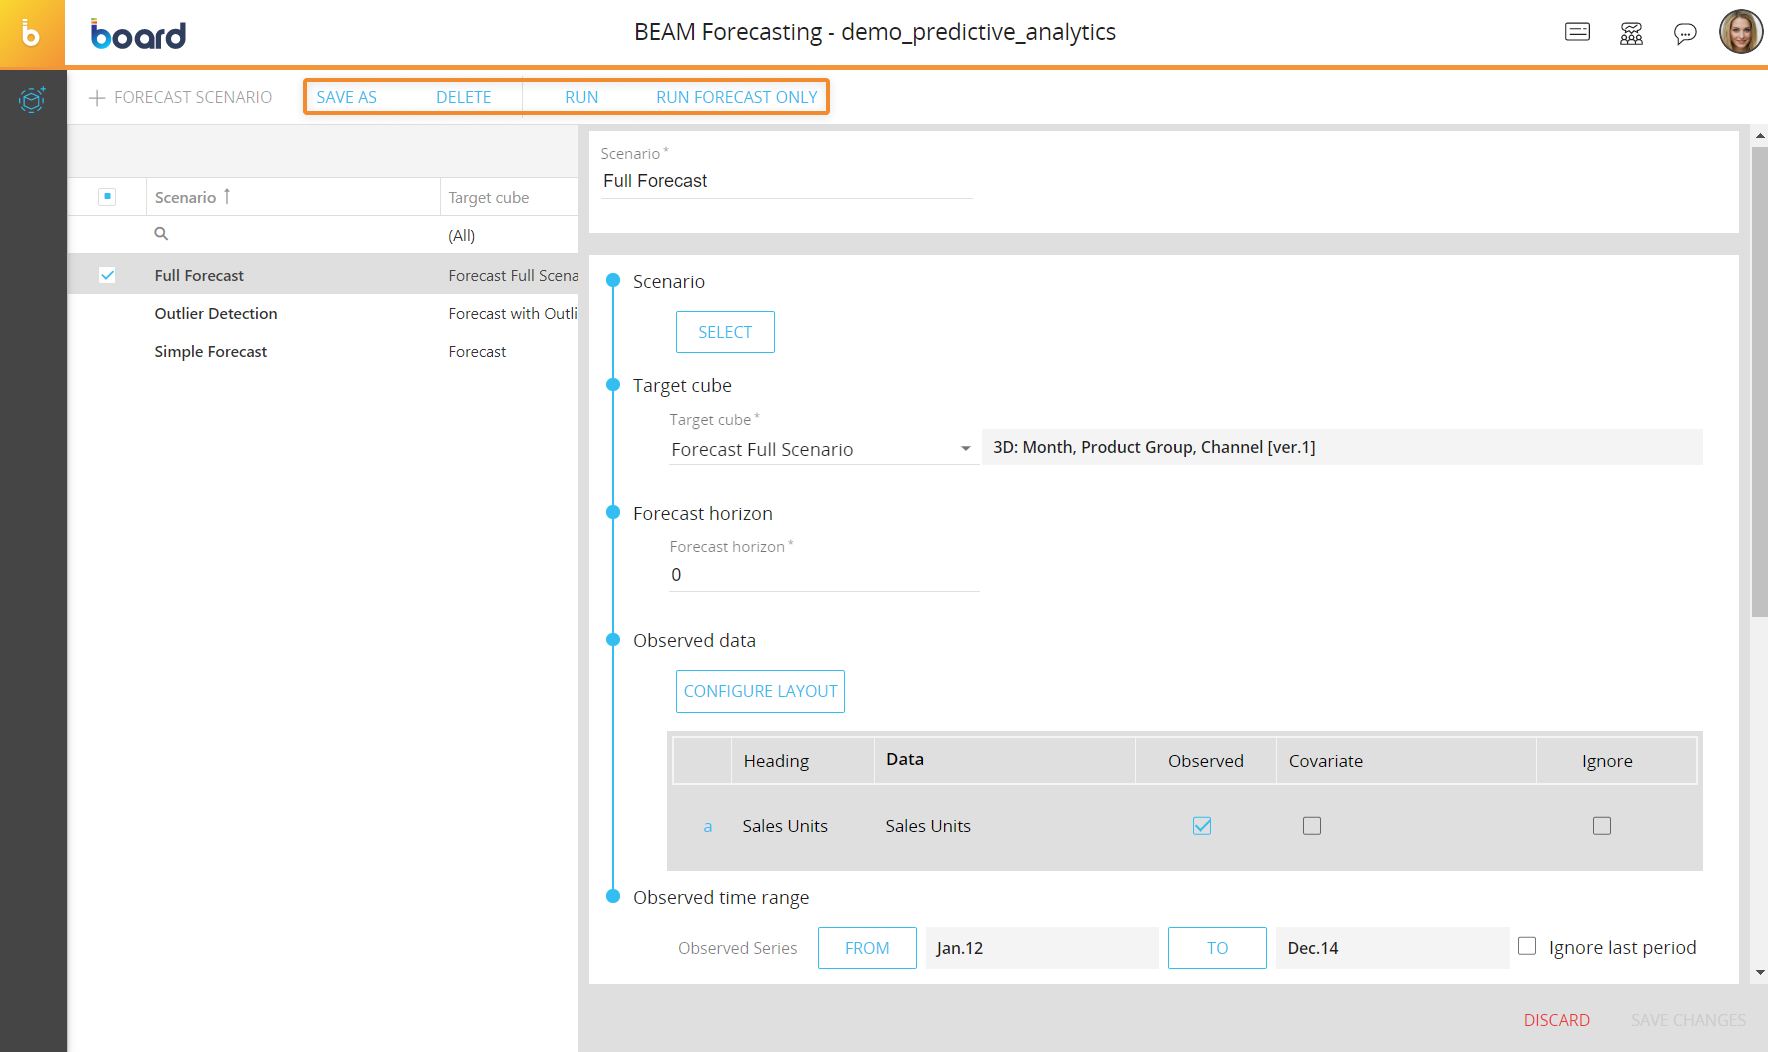
- Click on "+FORECAST SCENARIO" to bring up the scenario configuration panel
- Enter the name of the Scenario in the "Scenario field"
- (Optional) Click on the "SELECT" button to apply a selection. In this case, the forecast analyzes the time series only related to members included in the selection. Time Entities cannot be selected here, since the time range is defined under the "Observed time range" setting, explained in step 7 below
- Select the target Cube from the "Target Cube" drop-down list; the forecast results will be stored in this Cube. Once selected, its dimensions (granularity) will be listed next to the drop-down list. It is important to note that the target Cube determines the time series and the time period for the settings in the next steps
- Enter the forecast horizon in the "Forecast Horizon" field. This is the amount of time periods you want to forecast. For example, if you are doing a monthly forecast, you can enter "1" to forecast only one future month. Enter "0" to run a forecast until the end of the time range
- Configure the Layout of the historical data set. Here you should enter the Data Blocks that will be analyzed by the forecasting algorithms. For each Data Block, click on one of the options next to them to choose how they will be interpreted by the forecast scenario.
The available options are the following:- Observed. This is the Data Block that contains the historical data set whose future values will be forecasted by the scenario. Only one Data Block can be observed
- Covariate. This Data Block is a variable that can influence the outcome of a forecast scenario, but is not of direct interest. For example, if the observed Cube contains the sales of ice cream during a year, a covariate could be a Cube that contains the temperature of each day of that year, since the temperature usually affects the sales of ice cream. You can also set the maximum lag period of the covariate in the "Max Lag" field. This means that the covariate might affect the observed Cube values for a maximum time period indicated in that field, before and after the covariate event.
Enable the "Force" option to force the adoption of covariates that might not give any benefit to the forecast, which are usually discarded automatically - Ignore. Ignores the Data Block. This means that the forecast scenario will completely ignore the specified Data Block. These are Data Blocks that are needed in the Layout to perform calculations, but are not of direct interest.
- Click on the "FROM" and "TO" buttons to choose the start and end of the observed time range. The default values for the start and end of the time range are "First loaded period" and "Last loaded period" respectively, which cover the values of the observed Cube by starting from the oldest to the newest.
In addition, you can enable the "Ignore last period" option to ignore the last time period. For example, if the time range is configured from January 2023 to March 2023 and the option is enabled, the values of the observed Cube in the March 2023 period will be ignored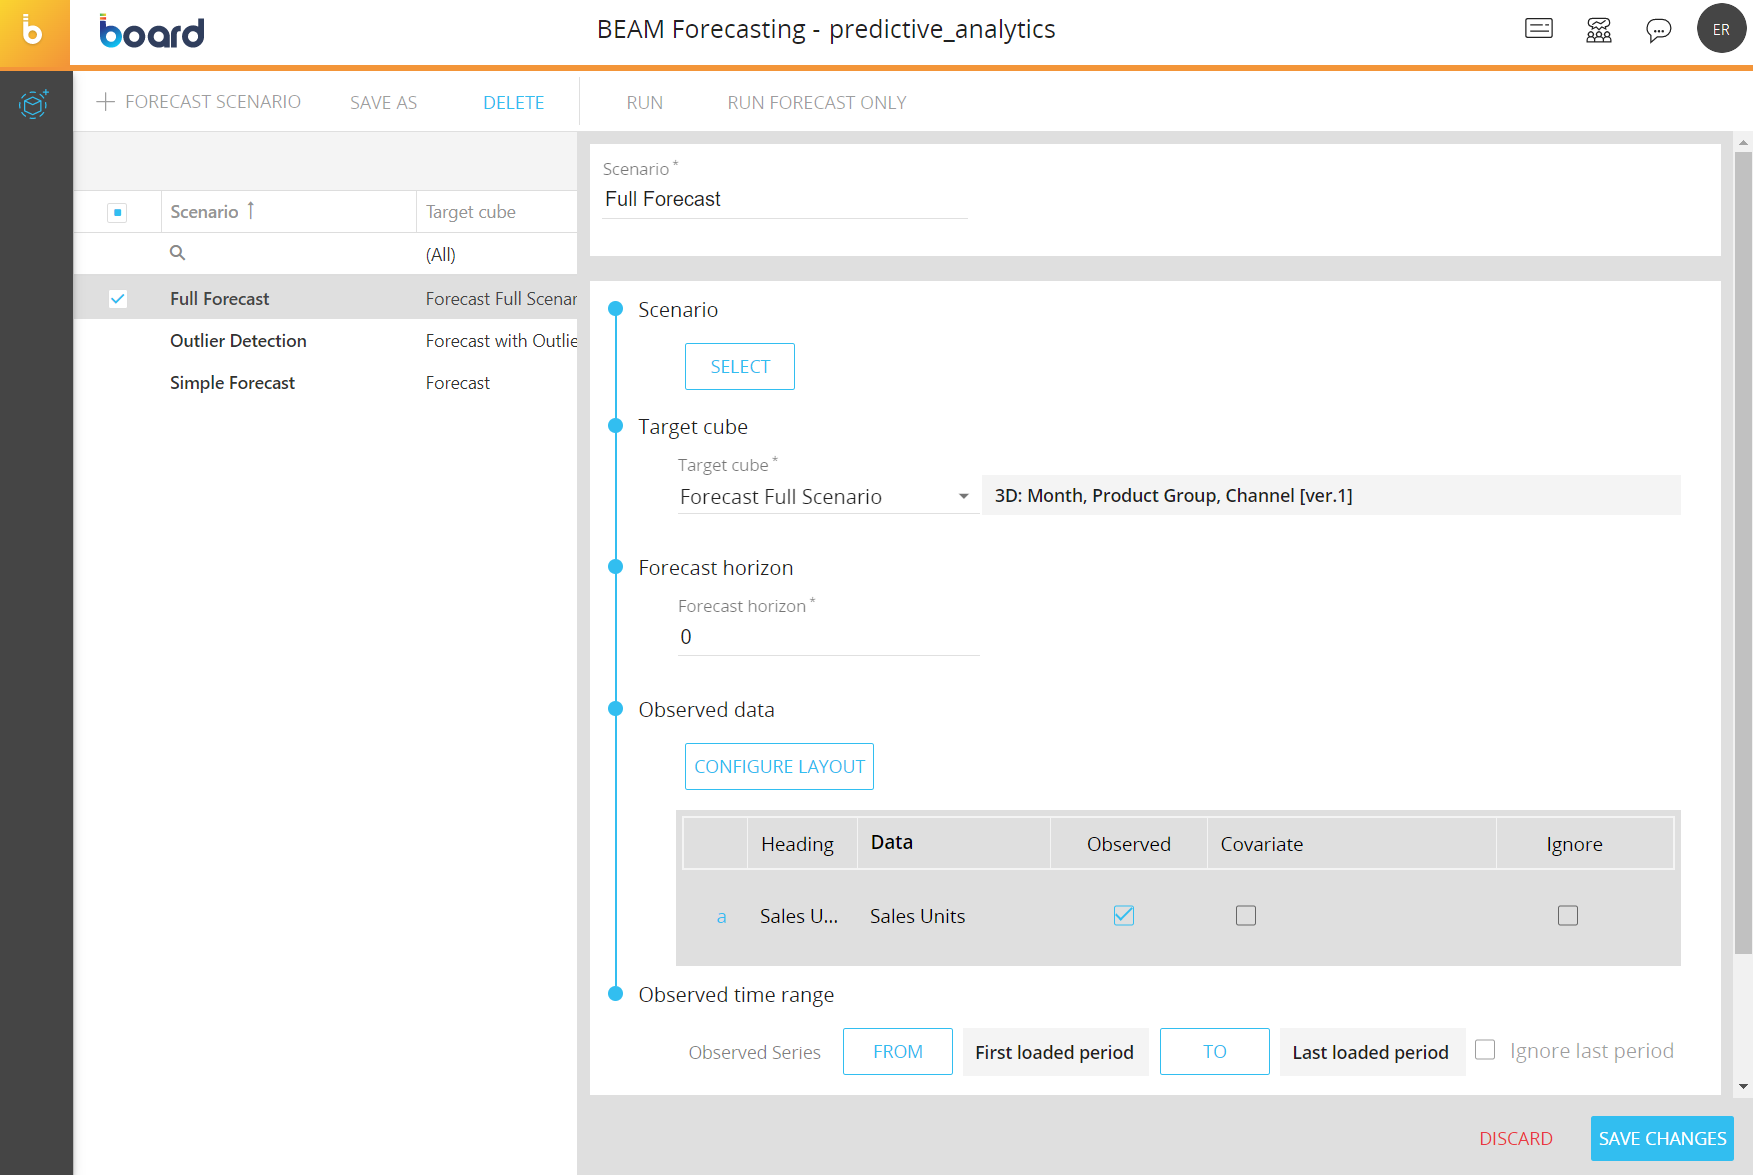
- Configure the following options under the "SCENARIO SETTINGS" menu to finalize the scenario creation:
- Confidence %. Enter the confidence interval. The upper and lower intervals depend upon the value of this field. The higher the confidence the wider the gap between upper and low intervals, therefore the greater the chance that the predicted result will fall within those intervals
- Global method. Here you must select your preferred method to get the forecast model between the following:
- Competition: This method uses different prediction models (i.e. ARIMA, Naïve etc.) and chooses the most accurate one to calculate the future values
- Naïve seasonal: This method observes only the values of one time period of the last season (usually previous year) and uses them as future values (for example, the values of January 2023 are used as a forecast for January 2024)
- Naïve normal: This method observes only the values of the most recent time period and uses them as future values (for example, the values of January 2024 are used as a forecast for February 2024)
- Clear. Here you must choose whether you want to automatically clear the entire target Cube or just the values within the observed time range when you run the forecast scenario
- Reconciliation. In the case of a multi-versioned target Cube, here you can choose one of the following reconciliation types:
- None: No reconciliation is done, therefore the target Cube might not be aligned
- Top down: This type of reconciliation allocates data from the less detailed version to the more detailed version (similar to the "Split Splat" feature of the Data Entry)
- Bottom up: This type of reconciliation aligns the target Cube
- Merge observed values. Enable this option to populate the target Cube with both historical and forecast values. Disable this option if you want the target Cube to contain only the forecast result values
- Positive values. Enable this option if you want to discard forecast models that contain negative results in some time periods
- Multi threading. Enable this option if you want Board to use multiple threads for the forecast calculations. Note that this option does not affect the forecast results, it is only useful in case of performance issues
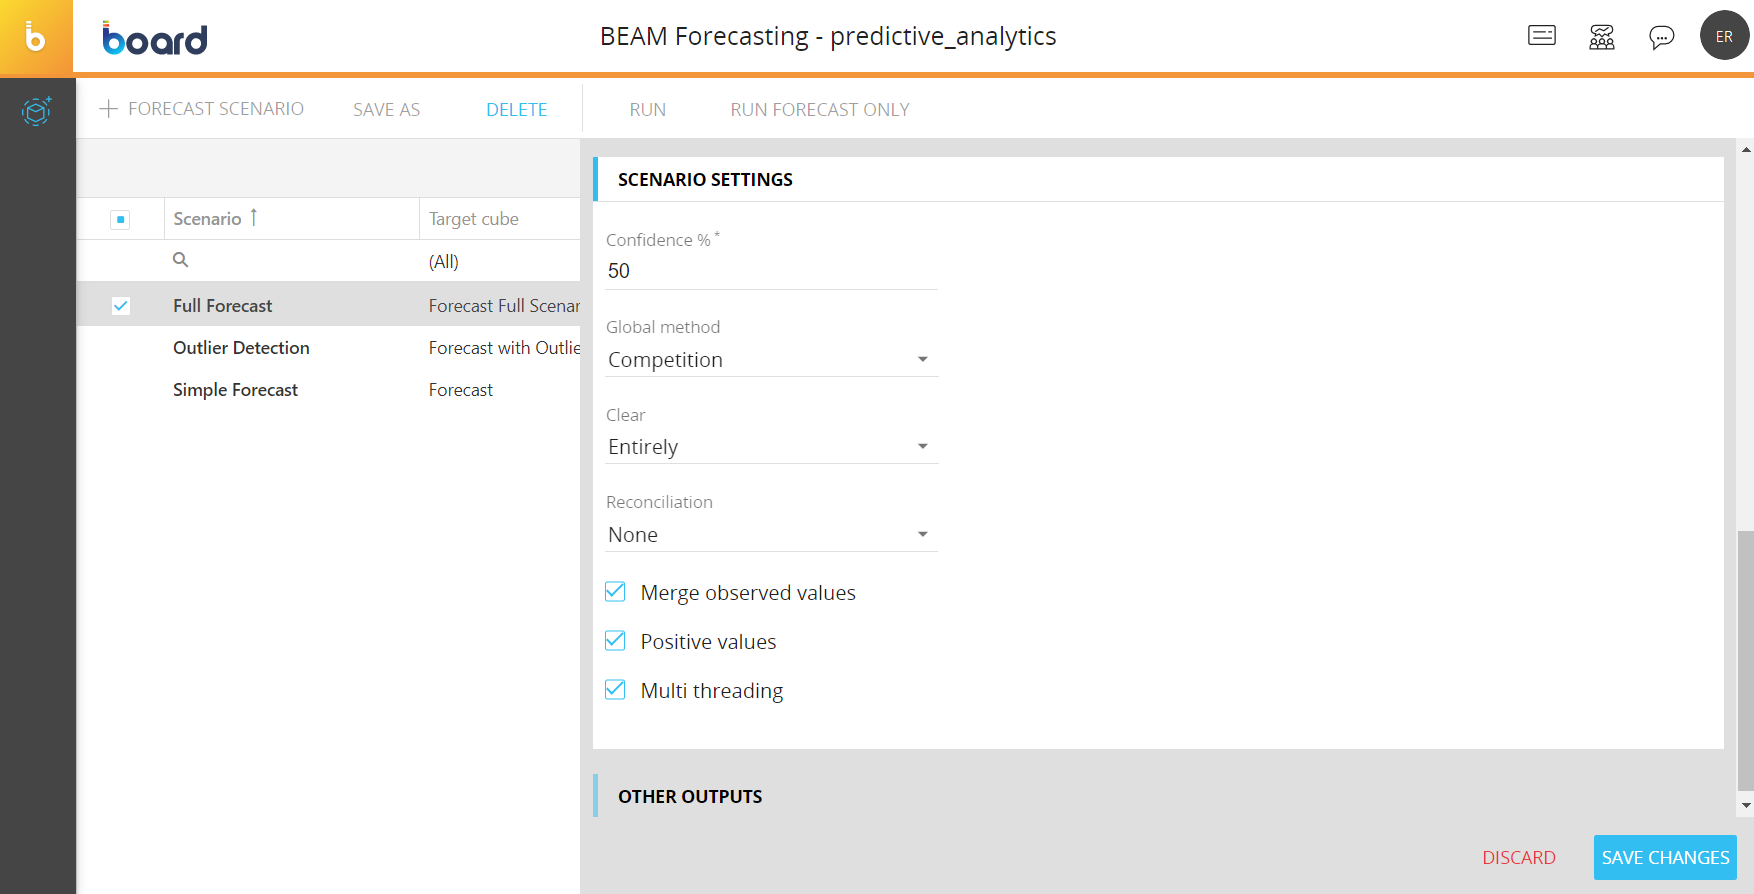
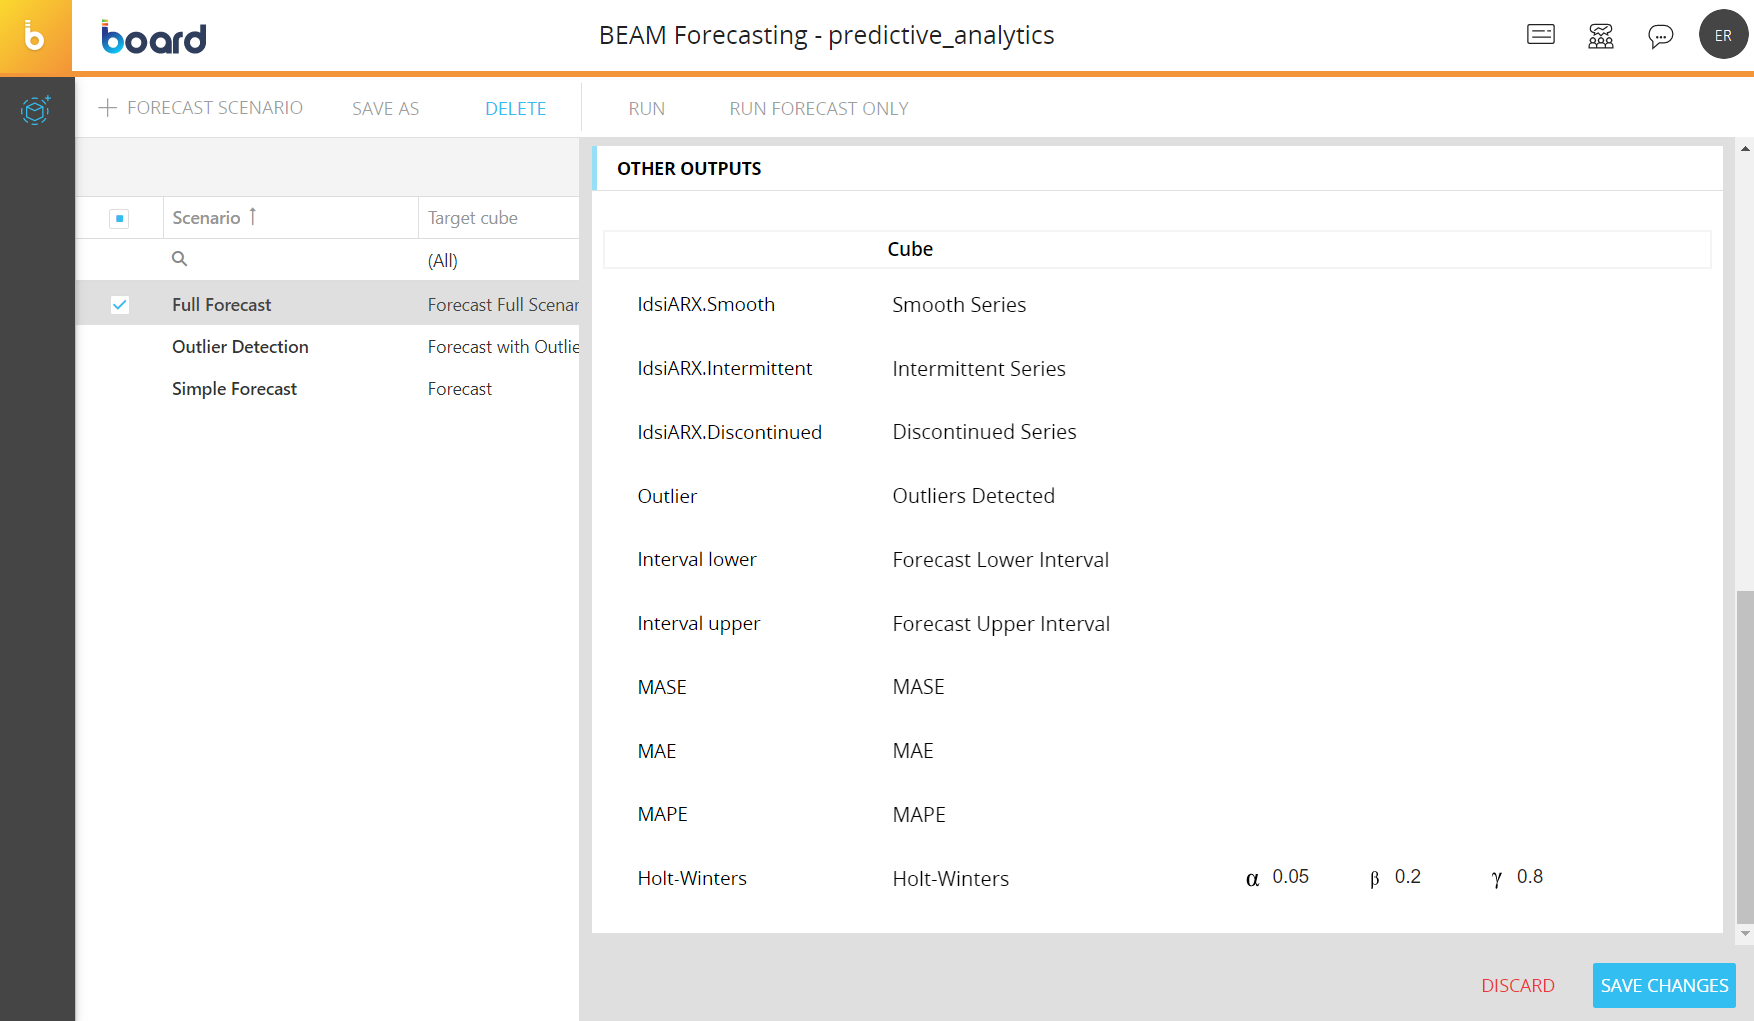
As previously mentioned, the B.E.A.M. forecast feature performs different calculations to achieve the final forecast result that is stored in the target Cube of the forecast scenario. The results of other calculations can be stored in different Cubes, if needed. The values in these Cubes can be useful to further study and refine the forecast scenario.
If you want to store these additional calculation results of the Forecast Scenario, open the "OTHER OUTPUTS" menu in the scenario configuration panel and configure the available options as described below:
- IdsiARX.Smooth. Choose the target Cube that will contain only the smooth time series of the forecast results
- IdsiARX.Intermittent. Choose the target Cube that will contain only the intermittent time series of the forecast results
- IdsiARX.Discontinued. Choose the target Cube that will contain only the discontinued time series of the forecast results
- Outliers. Choose the target Cube that will contain the anomalous values of the historical data set
- Interval lower. Choose the target Cube that will contain the lower limit values of the prediction interval. These values vary based on the confidence percentage entered in the "Confidence %" field but are always lower than the forecast results
- Interval upper. Choose the target Cube that will contain the upper limit values of the prediction interval. These values vary based on the confidence percentage entered in the "Confidence %" field but are always higher than the forecast results
- MASE. Choose the target Cube that will contain the MASE (Mean Absolute Scaled Error) values of each time series
- MAE. Choose the target Cube that will contain the MAE (Mean Absolute Error) values of each time series
- MAPE. Choose the target Cube that will contain the MAPE (Mean Absolute Percentage Error) values of each time series
- Holt-Winters. Choose the target Cube that will contain the results of the Holt-Winters model, also known as triple exponential smoothing. You can also configure the alpha, beta, and gamma parameters in their respective fields
The Cubes chosen for the outputs above must have the same structure as the target Cube of the forecast scenario.
Managing a Forecast Scenario
You can perform different actions on one or more existing forecast scenarios by selecting them and clicking on the different buttons that appear above the forecast scenario list.
The available actions are described below:
- To create a copy of an existing forecast scenario, select it and click on the "SAVE AS" button. A pop-up window appears where you can enter the name of the copied forecast scenario and save it
- To delete one or more forecast scenarios, select them and click on the "DELETE" button
- To run a forecast scenario with the learning phase, select it and click on the "RUN" button. The system will go through the learning phase first and then calculate the forecast
- To run a forecast scenario without the learning phase, select it and click on the "RUN FORECAST ONLY" button. The system will calculate the forecast based on the last completed learning phase. This is useful in the case of a large and complex historical dataset, where going through the learning phase every time you run the forecast scenario can take a long time
To edit a forecast scenario, select it to bring up the scenario configuration panel and modify the desired settings explained in the paragraph above.
You can also run an existing forecast scenario from the dedicated Procedure step. See B.E.A.M. Action group for more information.